
Introduction
The HydroTest PowerTool enables you to create a plan and a report that can be used in the field to execute a hydrotest plan. The tool can bring in a pipe from the asset hierarchy or you can type in all of your parameters to generate the plan. You can create sectioning based on differences in class location, hydrostatic head limitations, available water, or any of a number of parameters that would result in a new section being needed.
A LIDAR elevation model is utilized to generate the elevation profile per pipe segment, and the user can create as many test sections as needed and then generate a consolidated project report that contains all of the information that the operator needs in the field in order to test to execute the plan safely.
Accessing Hydrotest PowerTool
The Hydrotest PowerTool can be accessed by selecting Hydrotest PowerTool from the Integrity Tools dropdown on the Navigation Bar at the top of the screen.

New and Existing Cases
Users may select existing cases by clicking on the dropdown next to Select Case. Existing cases include those shared by the user’s team using the Collaboration Feature, cases the user has created in the past, and demo/default cases created by Technical Toolboxes.
Users can create new cases by clicking the Add Case button depicted in the image below.
![]()
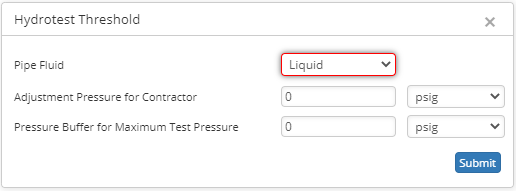
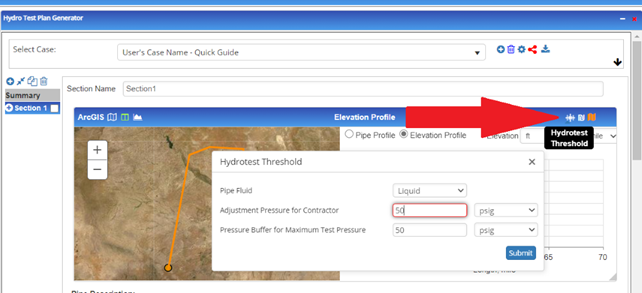
This opens the Hydrotest Threshold window, where users can select the Fluid (Gas or Liquid) and set Adjustment Pressure for Contractor and/or Pressure Buffer for Maximum Test Pressure.
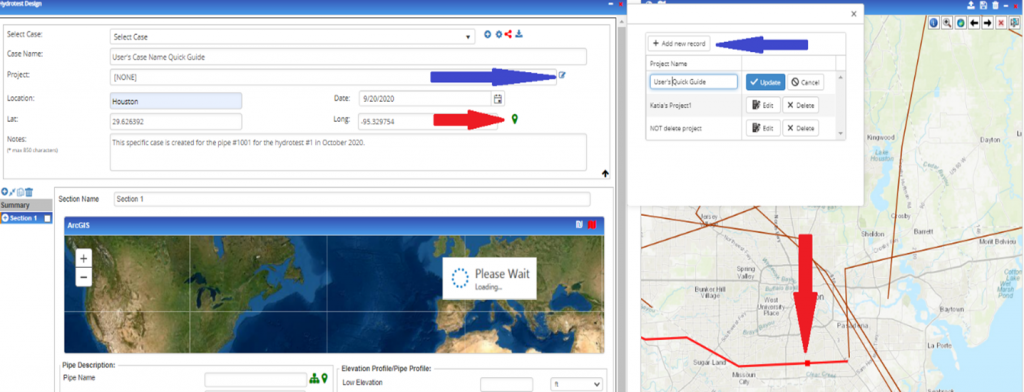
By clicking on the black arrow to the right of the Select Case field, users may enter a Case Name, Location, and other details.
As an alternative to manually inputting Latitude and Longitude coordinates, users can use the Map Feature by clicking on the icon next to the Long. field. The ArcGIS map will open in an additional widget window within the same Canvas. By resizing each window, the User can place the Hydrotest and Map windows adjacent to each other.
Pick project location by clicking on the map. That will auto-populate the coordinates in the hydrotest window. The red arrows indicate this in the screenshot below. There is also an option for the user to combine a group of hydrotests or other cases (even from other widgets) into one project.
Importing Pipeline Data into the Hydrotest PowerTool
In addition to manually inputting pipeline data into the fields of the Hydrotest PowerTool, there are two ways to quickly import pipeline data: through the ArcGIS Map tool and through the Hierarchy.
Importing through ArcGIS
The first step to importing pipeline data for the Hydrotest PowerTool is to import pipeline data into ArcGIS, creating entities representative of pipelines. This will allow the user to visualize the imported pipeline data and to create entities that can be edited and divided into sections. If users have the Navigator Addon licensed, this process will also add the entities into the Hierarchy Panel.
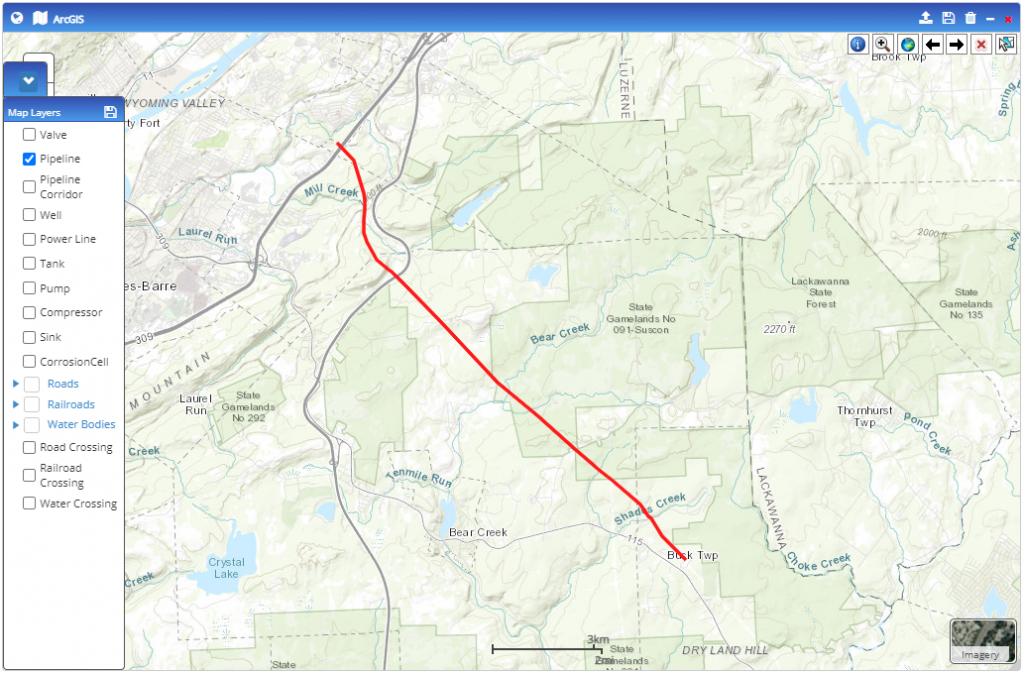
- Access the ArcGIS map by selecting ESRI Map from the blue ribbon at the top of the screen.
- Select the
 button in the lower left corner of the map, and check the boxes next to the entities that you would like to view. For the Hydrotest PowerTool, Pipeline is the most applicable entity.
 - To import entities, in this Pipelines, into the ArcGIS map:
- Click on the
 button at the top right of the map to import pipeline data.
 - Select either the Overwrite or Retain option, and then click Upload File (KML/Shape Files/GDB).
- Select the applicable file and click Open.
- In the dropdown of the entity that matches the imported file, select doc and click the adjacent Map Columns button.
- Select the applicable fields from the dropdowns to their corresponding columns. Some fields will auto-populate. When all applicable fields are mapped, click Done.
- Click Save Mapping
- Click the
 button in the top right of the ArcGIS window to Save.
 - Repeat these steps for all entities that need to be imported, saving between each one.
- Click on the
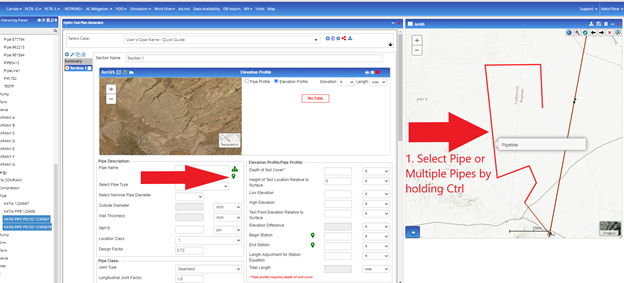
Once the pipeline data has been imported and the pipeline is visible on the ArcGIS map, select either a single pipeline by left clicking it, or select multiple pipelines by holding the CTRL key and clicking each one.
Now, return to the Hydrotest PowerTool and click on the Map Icon as shown on the screenshot below. The pipe gets assigned to the case and attribute data gets loaded into Section 1.
Importing through the Hierarchy
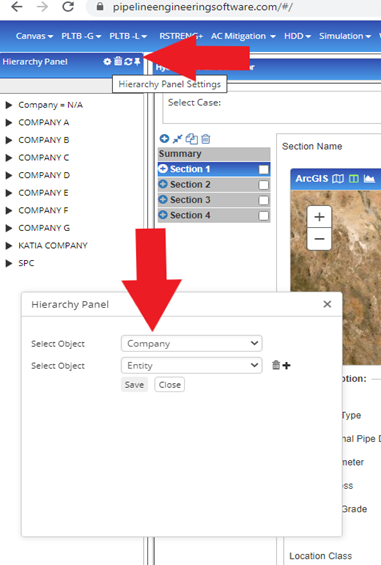
The column on the left of the screen is referred to as the hierarchy panel. By default, the hierarchy panel lists all available pipes (specific to the user) within the Hub database. If the pipeline(s) that the user wishes to perform the hydrotest on is not available in the hierarchy because it has never been imported/created, the user can import the data through the ArcGIS process outlined above, or create a new entity through the hierarchy. The hierarchy can be configured by clicking on the gear button within the hierarchy panel. The user can set a maximum of 6 levels in the hierarchy panel. Click on the plus icon to add a row and then access the dropdown to select the hierarchy level. Additional levels can be entered by clicking the plus icon and deleted by clicking the delete icon. Clicking save will commit the selection and display it on the hierarchy panel.
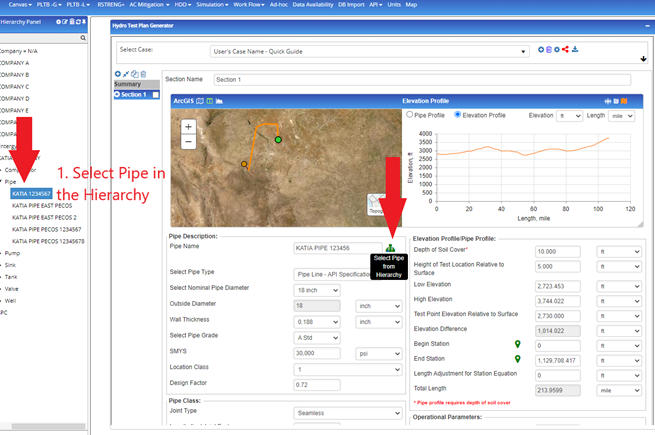
Users can import assets from the hierarchy into the Hydrotest PowerTool. Select a pipe or multiple pipes from the hierarchy panel, then click on the hierarchy icon (designated by the arrow in the image below). This will bring in attribute data into Section 1 as shown in the screenshot below.
Begin Station and Section Creation
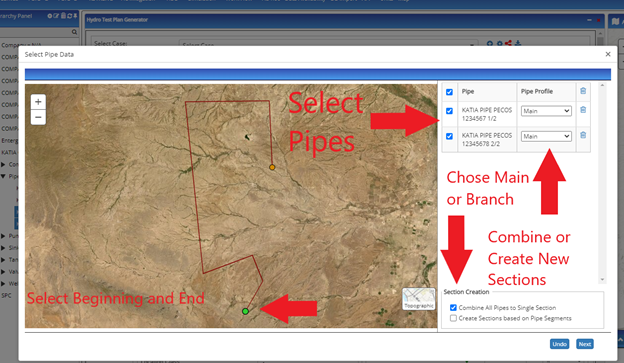
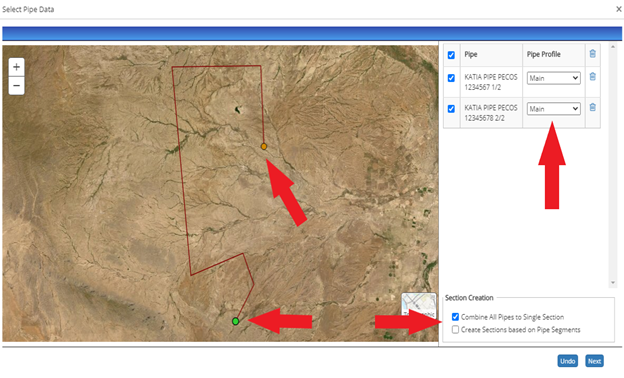
A new window will appear asking the user to:
- Select which pipes to upload into Section 1.
- Choose if Pipe Profile is Main or a Branch (branch data will be skipped).
- Select Beginning and End of the pipe.
- Combine selected pipes into one section or create new sections for every pipe segment based on
- To swap the Begin Station and End Station, simply click either the red or green circle on the map depicted below.
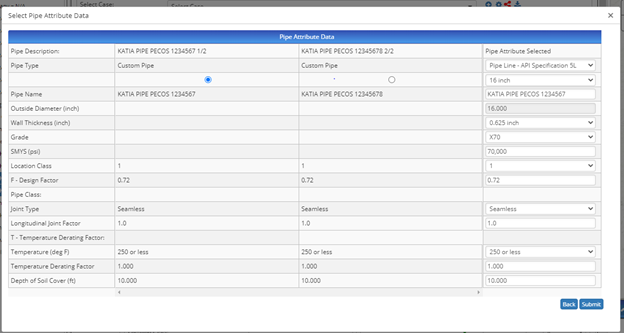
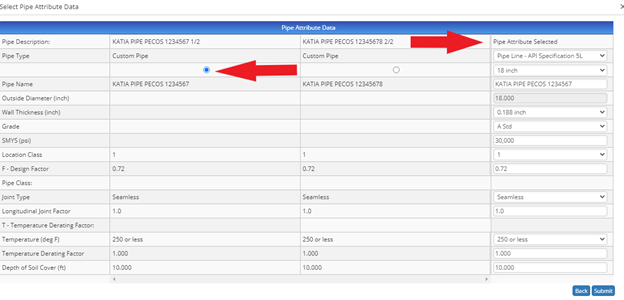
Users have the option to select pipe attributes of existing pipe segments or overwrite with new entered values in the last column, as seen in the image below.
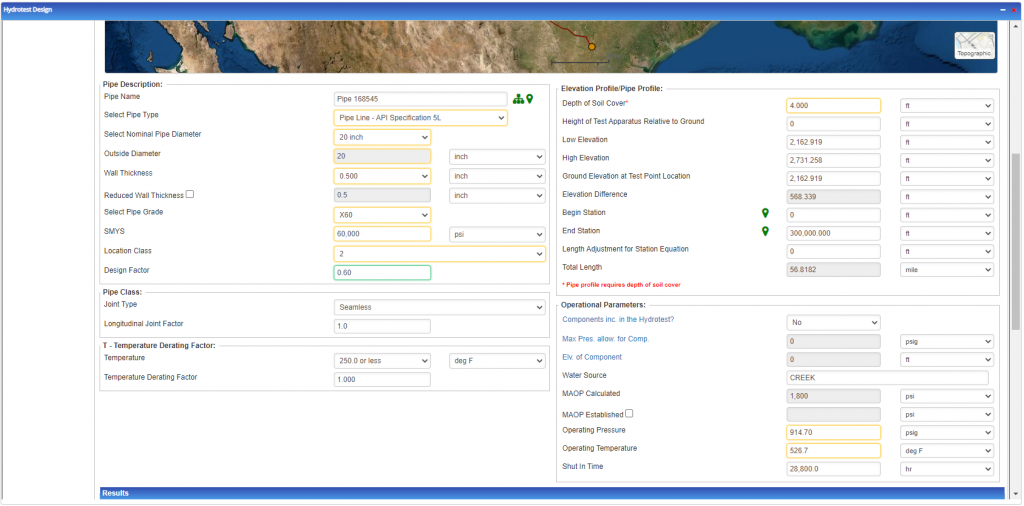
Available pipe attribute data will automatically populate into the Hydrotest PowerTool. If a Section 1 tab is highlighted orange, this means that some of the required data is missing. Users need to ensure that Pipe Type, OD, Wall Thickness, Grade, SMYS, Location Class, design factor, etc… are entered to be able to run the Hydrotest calculation.
Elevation Profile and Case Data
Calculate elevation from the Map by clicking on the map icon as shown in the image below. Elevation profile in the summary tab will be auto-loaded when the user brings in the pipe. ArcGIS map and Elevation are combined into a single window now. Users can switch the view from the selection at the top of the ArcGIS map.
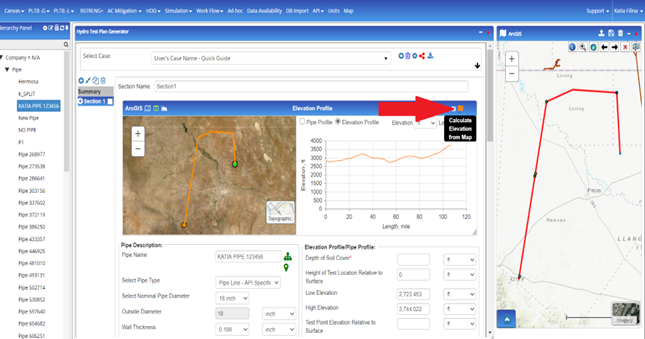
The Threshold is a pop-up window that can be accessed from any section by clicking on the icon to the left of the Highlight Map icon. Users must select pipe fluid, adj. pressure for contractor, pressure buffer for max test pressure by clicking on the Hydrotest Threshold icon in the screenshot below.
Test Point Evaluation & Height, Length Adjustment for Station Equipment, add Components (if any included in Hydrotest), Shut-In time MOP, Operating Pressure and Temperature values must be populated or entered to be able to calculate the Hydrotest case.
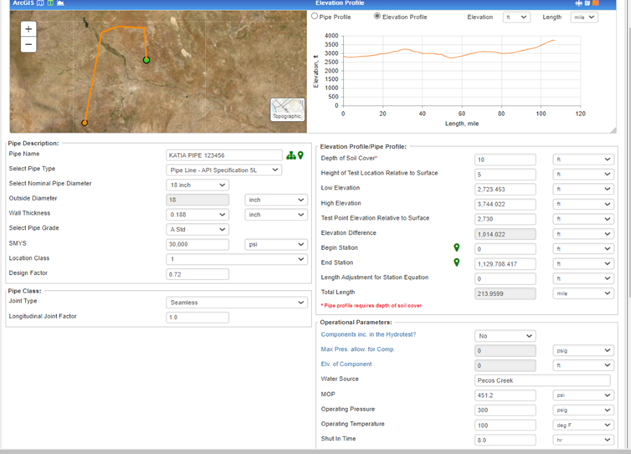
The low point elevation and high point elevation are specific to section selection. This will auto-populate based on the ‘Begin station’ and ‘end station’ data entry. Once the data is entered and ‘Calculate elevation from map’ button is clicked to highlight the section, the data for Low Elevation and High Elevation is auto-populated.
Enter Test Point Elevation, Length Adjustment for Station Equipment, add Components (if any included in Hydrotest), Shut-In Time, etc… Users need to make sure that MOP, Operating Pressure, and Temperature values are populated to be able to save and calculate the case.
Adding Multiple Pipes to the Case
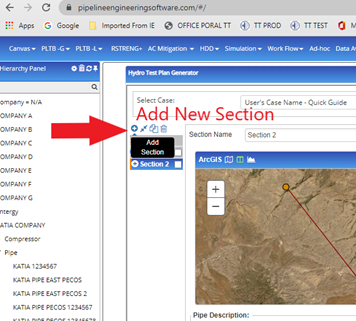
To add an additional section, click on the Plus sign as shown in the screenshot below.
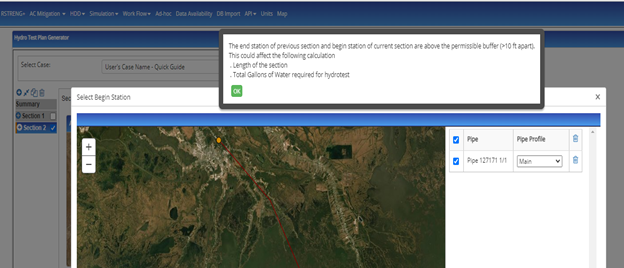
Users can bring in new pipe to Section 2 by using the Hierarchy or Map. If selected pipe is not a continuation of the previous section, a warning message will appear as shown in the screenshot below.
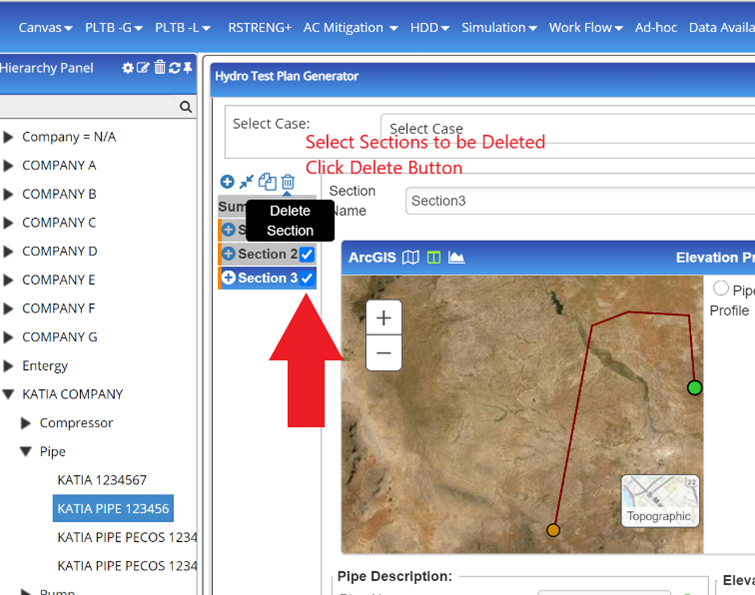
To delete earlier sections, select the Section then click the delete icon.
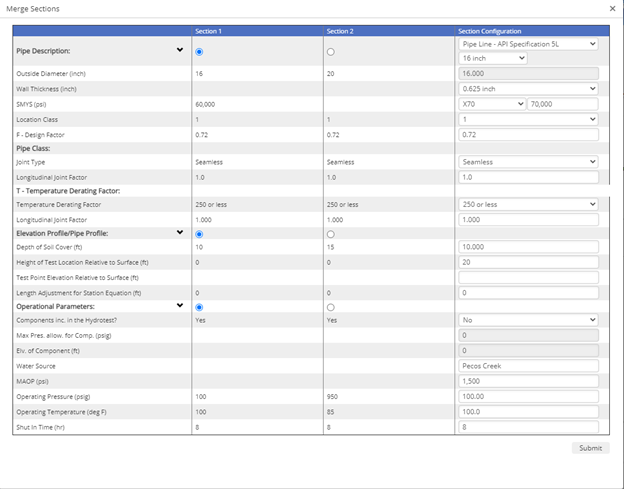
To merge two sections, select the Sections and then click the Merge icon.
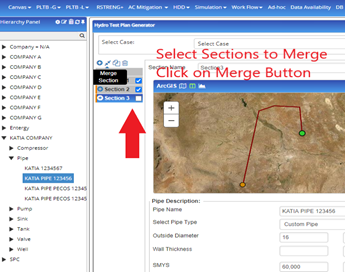
After this, a new window will pop up asking users to select which section’s pipe attributes should be used for the merged section. Users can overwrite pipe data in the last column on the right.
To bring in multiple pipes, hold CTRL and select multiple pipes (using hierarchy or map), then select the icon to bring in pipe attributes. A window will pop up with the following options:
- Select which pipes to bring in
- Pipe profile with dropdown menu gives users options to classify pipe as a branch or main pipe. Branch pipes will be excluded from the final pipe loaded into the hydrotest widget.
- Select beginning and end of the pipe segment (green and orange dots). The user also has the option to change the orientation of the pipe by clicking on the beginning and end.
- Select to combine multiple pipes into one section or create sections based on each pipe segment.
When data for multiple pipes is being loaded, a new window will pop up. Users must select which pipe attribute data will be applied to the section, or overwrite the data by entering values in the “Pipe Attribute Selected” tab. The final data in the Pipe Attribute Selected tab will go to the created section.
Calculations and Report
When all required data is entered, click on the Calculate button at the bottom right corner of the Hydrotest PowerTool. If there is an issue with the length of the pipe segment, elevation difference, pipes not being connected, etc…, warning messages will be displayed under the “warning” tab. A “Calculation Complete” message will pop up and the results will auto-populate under the “results” tab. Execution done per section will calculate results from the section selected. Execution done from the ‘Summary’ tab will execute all sections part of the case.
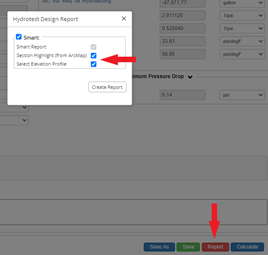
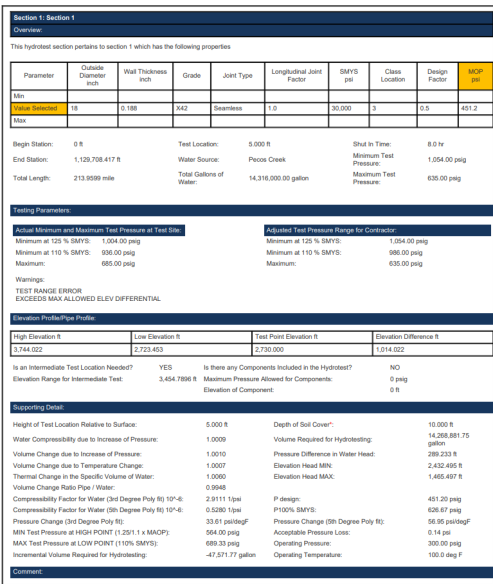
To create a PDF report, click on the red ‘Report’ button. The following options will be listed:
- Include Section Highlight from the ArcMap
- Include Elevation Profile
If report is not appearing, try disabling any active pop-up blockers. Min, Max, and Value Selected , as shown in the report table (image below), will be available when the pipe selected for the section has multiple sections within it.
Resources
Here are some short videos to
help understand the functionality
of the Hydrotest PowerTool:
- Hydrotest PowerTool Overview (86 sec)
- Generating a Report (90 sec)
- The Hydrotest PowerTool Planned Pressure Test Webinar (1 hour)
- More videos will be coming soon