- Log in to the application using the credentials provided by Technical Toolboxes.
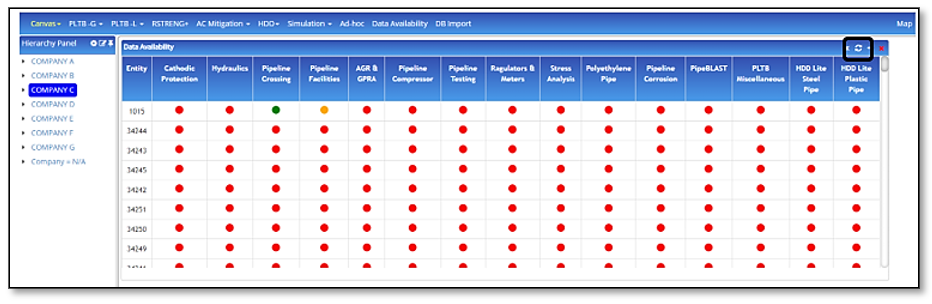
- Click on “Data Availability” from the application menu bar
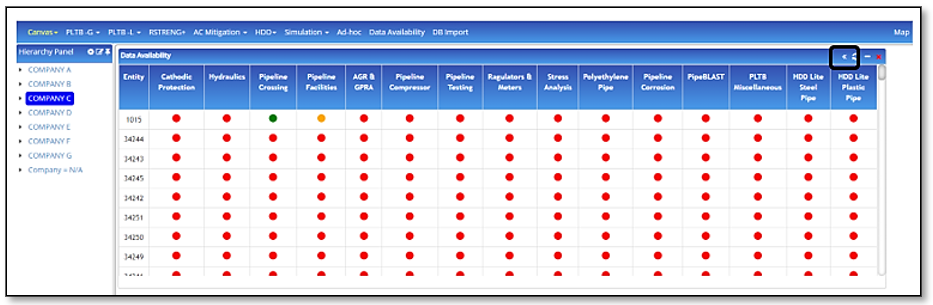
- On clicking “Data Availability” loads the Data Availability widget on the canvasNote: Data Availability is available only when the user has subscribed for the hierarchy panel
- The hierarchy/map controls what is displayed in the entity column.
- If the user selects an asset on the hierarchy, the entity column in the data availability lists all pipes associated with the asset selected.
- The columns in the data availability widget represent the entities available in the user’s environment and the applications to which the user has access.
Data availability screen is used to display the percentage of known and unknown parameters of each entity in terms of the application, module, and calculation. - The color indication is as follows:
- Red indicates that 0 – 50% of data is available for the selected entity.
- Orange indicates that 49 – 99% of data is available for the selected entity.
- Green indicates that 100% of the data is available for the selected entity.
- The user has the flexibility to view data for submodules (three levels of modularization are supported – Example: The user can view data for PLTB-G and upon selecting PLTB-G, expands the list of all modules under PLTB-G. The user can then click on Cathodic Protection, which expands to display all calculations within Cathodic Protection).
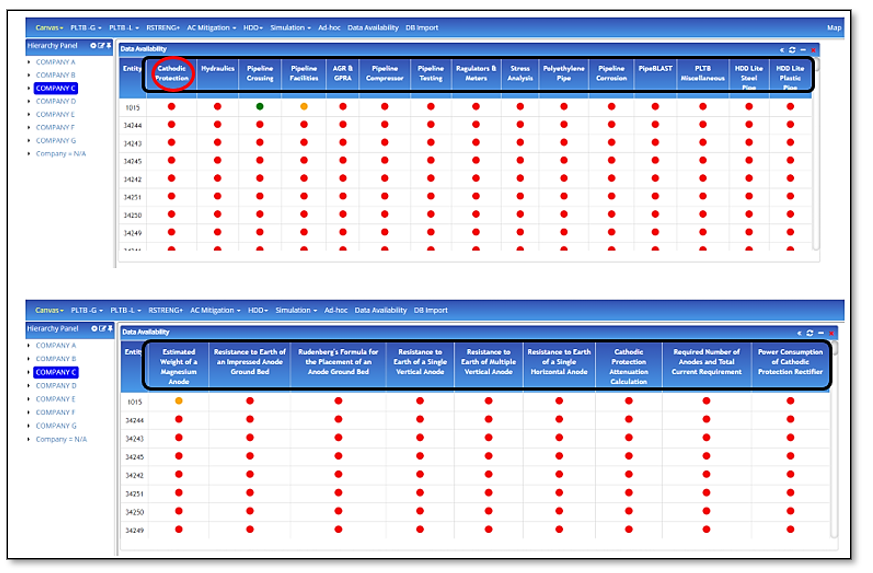
- The user can opt to go back to the previous screen of sub modularization by clicking on the back button
- The data loaded to the availability screen is from the last updated data. When the user clicks “on-demand” a message prompts the user “This may take a long time, do you want to continue?” When the user clicks “OK”, it loads the current data from the database.