The Report module provides a means for exporting an echo of input data as well as analyses results in the form of text files. The following reports can be generated using the options provided in this module:
- Entries and Models Report
- Summary of All Data and Analyses
- Static Analysis Report
- Fatigue Analysis Report
- ECA Report
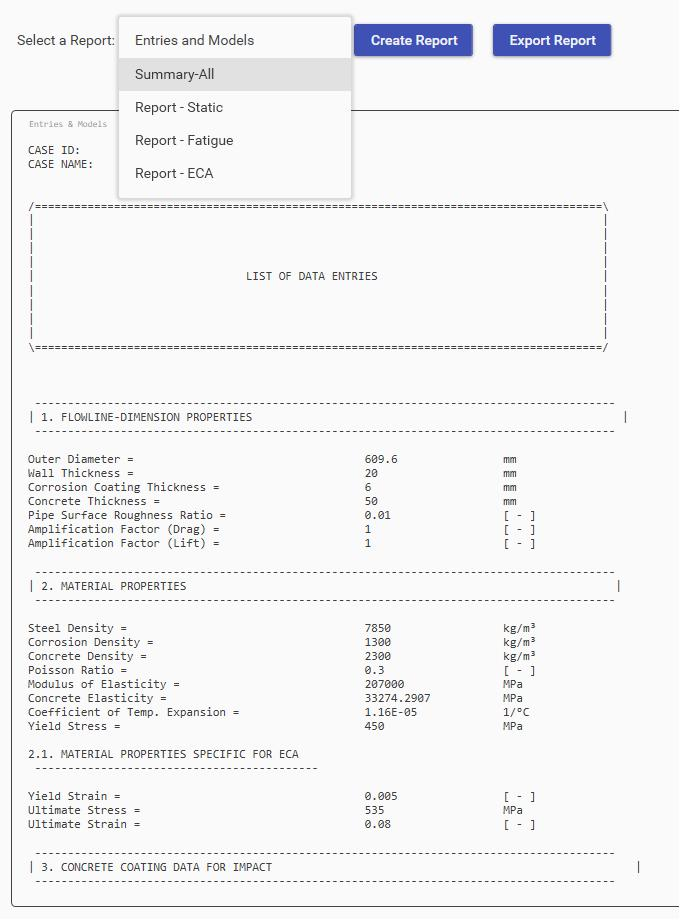
A general view of the Report module is shown in the Figure below. The reports can be generated by selecting the report type and clicking on the “Create Report” button. After creation of the report, the displayed information can be exported as a .txt or .pdf file by clicking on the “Export Report” buttons. For unit change to take effect in the Report module, the required report shall be generated after changing the unit system.
Entries and Models Report
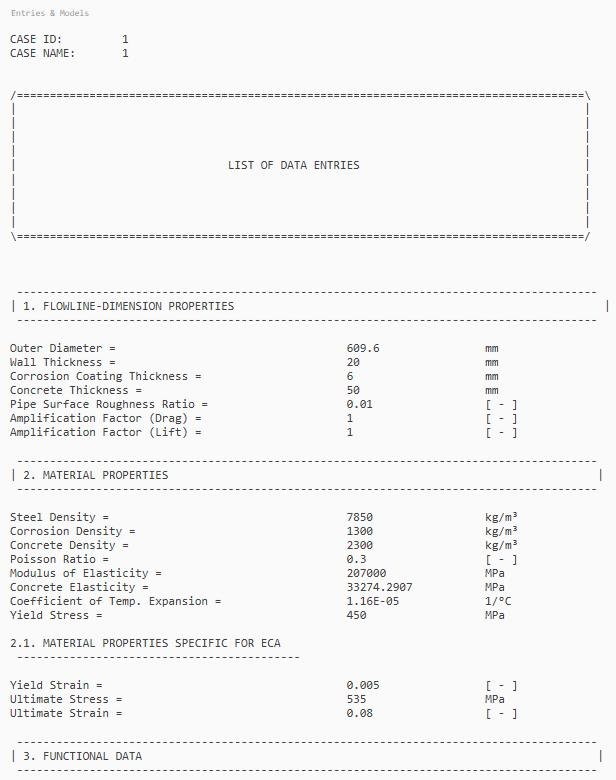
A sample view of the “Entries and Models” Report is shown in the Figure below. All the input data, including flowline dimension properties, material properties, functional data, soil data, river data, fatigue data, ECA data, and intermediate model parameters are presented in this section.
Analyses Summary
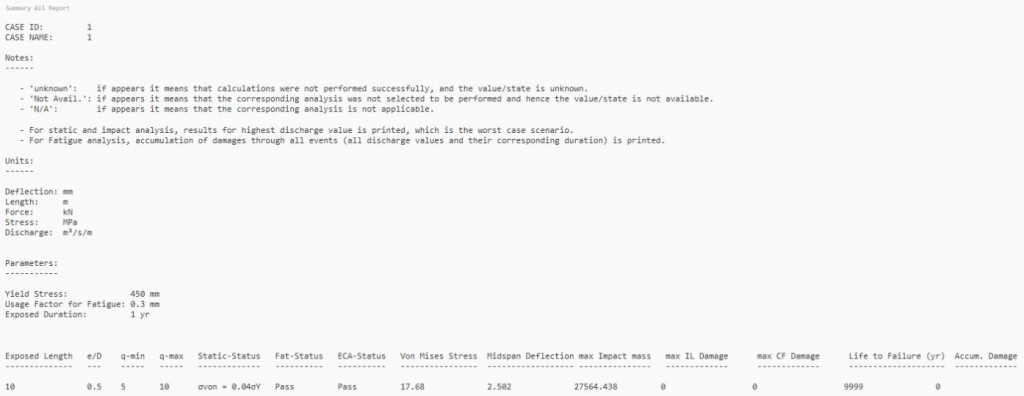
A sample view of the “Analysis Summary” Report is shown in the Figure below. This report includes key outputs of all the performed analyses for all models. Additional clarifying notes are provided at the beginning of the report.
Static Analysis Report
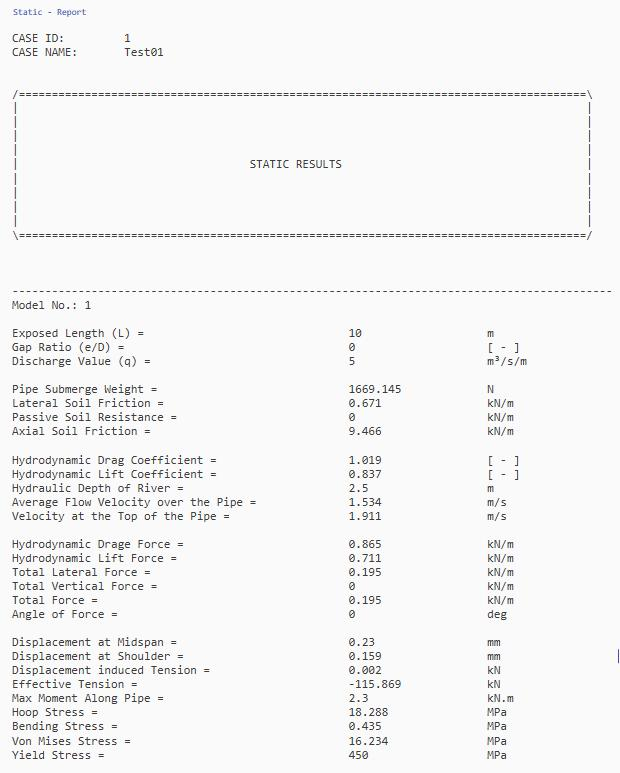
The detailed results of the static analysis for each model are presented in the “Static Analysis” Report as shown in the Figure below.
Fatigue Report
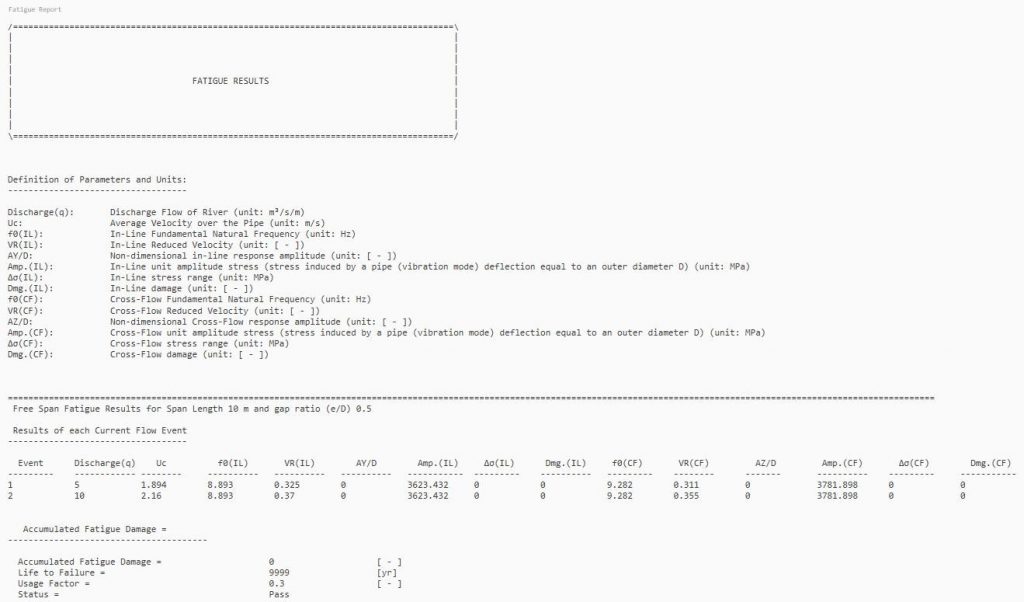
Free span fatigue results for each model at each event (a river flow condition that occurs during a year) are presented in the Fatigue Report. A sample is shown in the Figure below. Definition of the parameters and units are presented at the top of the report.
Accumulated fatigue damage is calculated at the end to account for various events (flow conditions) throughout the year.
ECA Report
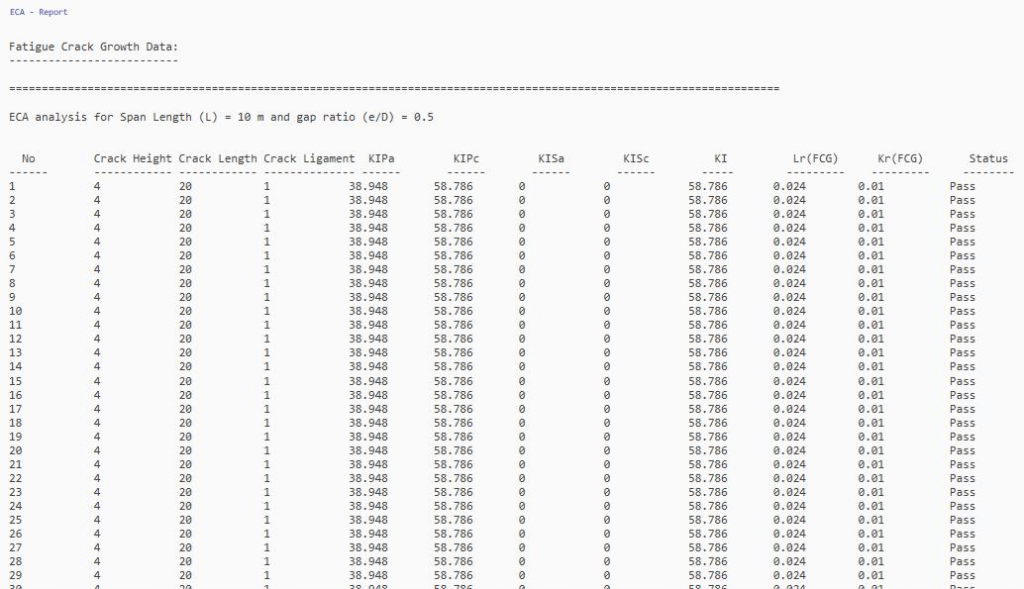
The ECA Report includes the stress-strain curve data followed by fracture mechanics-based fatigue assessment and fracture assessment results for each model. Each model consists of 1000 fatigue increments and fracture assessments. A sample fatigue crack growth data is shown in the Figure below.
Related Links
Table of Contents
Table of Pages
- Pipeline HUB User Resources
- AC Mitigation PowerTool
- API Inspector’s Toolbox
- Crossings Workflow
- Horizontal Directional Drilling PowerTool
- Hydrotest PowerTool
- Pipeline Toolbox
- PRCI AC Mitigation Toolbox
- PRCI RSTRENG
- RSTRENG+
- Ad-hoc Analysis
- Database Import
- Data Availability Dashboard
- ESRI Map
- Report Builder
- Crossings Workflow
- Hydrotest PowerTool
- Investigative Dig PowerTool
- Hydraulics PowerTool
- External Corrosion Direct Assessment Procedure – RSTRENG
- Canvas
- Definitions
