
Objective
The User Guide for the AC Mitigation PowerTool’s Fault Current module serves to guide the user through modeling and mitigating AC corrosion under fault current conditions. This guide will cover creating and importing pipeline data, through modeling the effects of AC current on the pipeline, along with inputting and modeling the effects of mitigation on the pipeline.
Getting Started
Prior to initiating the Fault Current module in the AC Mitigation PowerTool, the user must build a case in the Steady State module with the associated pipeline(s) and power line(s). To facilitate this process, users can access the AC Mitigation Powertool Steady State User Guide. Once the case has been built, users should create a New Case in the AC Mitigation Fault Current module and import the Steady State case’s data by selecting it in the dropdown next to the Steady State Case field, and then clicking on the Arrow button.

Pipeline operators use PHMSA approved RSTRENG© program that is specified in the pipeline industry Code of Federal Regulation (CFR). Technical Toolboxes is the sole provider of the official RSTRENG© program. B31.G, Modified B31.G, and RSTRENG© will now be referred to as RSTRENG© providing the user with all necessary tools, including RSTRENG© to assess, analyze and assist in the mitigation of the effects of blunt metal loss corrosion defects.
In addition, Technical Toolboxes provides programs that consist of training and testing for those individuals seeking technical RSTRENG© certification for Pipeline Integrity Inspectors, Technicians, and Engineers to assess corrosion and related blunt defects.
Faulted Tower
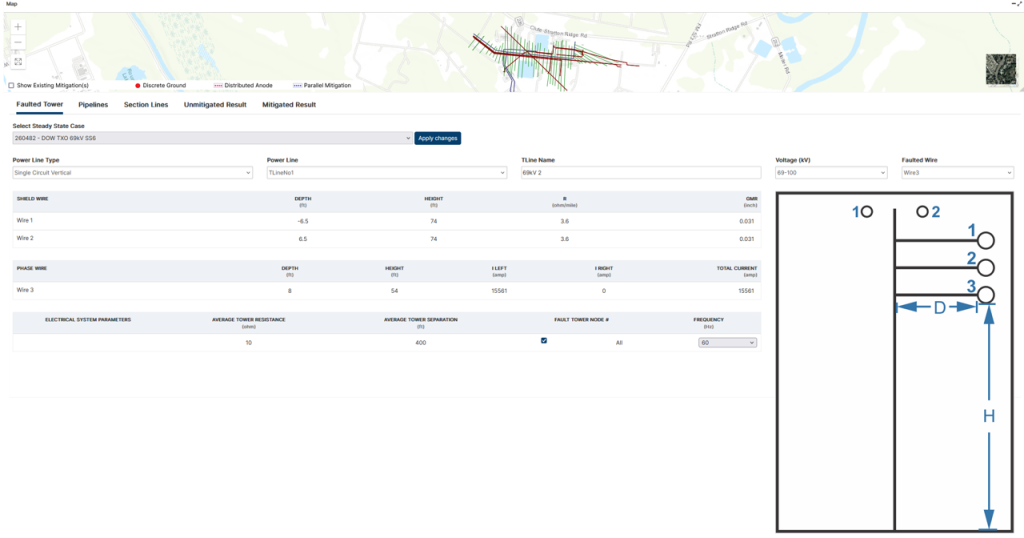
After importing the Steady State case, users should ensure that the data in each field is accurate. Specifically, users should ensure that the correct wire is designated in the Faulted Wire field and that the Power Line Type is accurate.
- For assistance in determining the I Left (amp) and I Right (amp) and Average Tower Separation values, refer to the Tower Circuit Fault Voltages and Currents Table in the Theory Guide.
- If Average Tower Resistance (ohm) is unknown, it is recommended to use a value of 10 ohms.
- Fault Tower Node # corresponds to the sections created in the Pipeline tab initially created in the Steady State Module. Note that Pipeline Sections can be edited in the Pipelines tab of the Fault Current Module as well. Specifying a Tower Node # denotes at which section/node the fault has occurred. This feature allows the user to analyze the sections/nodes in a more granular way. It is recommended to use the All option by default. When a user specifies a tower node, an orange dot appears at the corresponding location on the ACPT Map
Pipeline
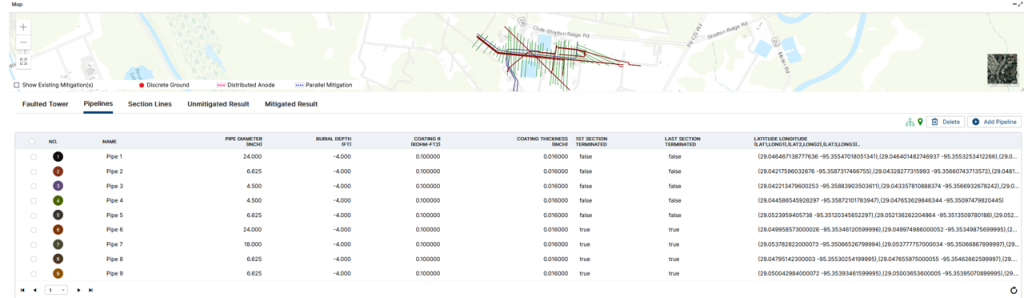
- The Pipeline data has been imported from the associated Steady State case.
- Users should review all fields to ensure that they contain the appropriate data, and modify any that they wish to change by clicking into the appropriate data field.
Output
- To populate the Output tab once the Pipeline sections have been generated, click on the ‘Calculate’ button on the ribbon/header at the top of the calculator.
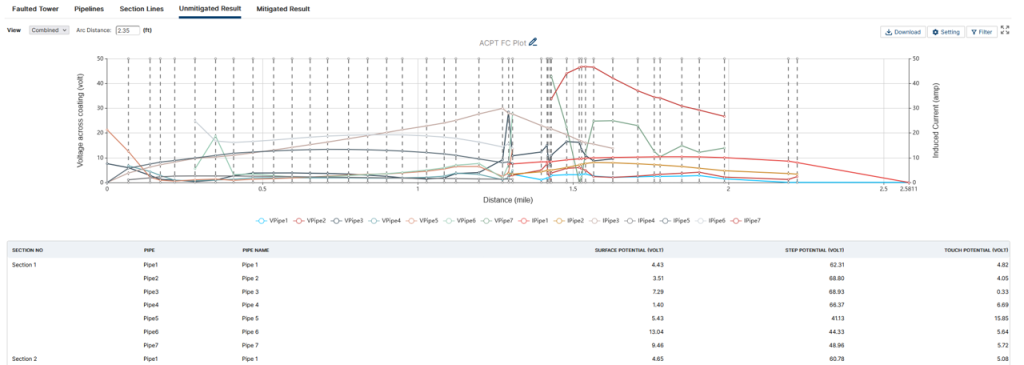
- In the Output section, users can view the induced voltages (blue line, labelled VPipe), induced current (red line, labeled IPipe), and AC current density (green line, labeled IACPipe) on the pipelines either on individual graphs or combined into one graph.
- Users can also toggle the Section designations on or off by selecting or de-selecting the check box next to Section.
- Additionally, users get Quick View versions of the Sections, Results, Mitigation, Bond Connections, and Pipe Length Depth in this tab.
- Note the additional pipe table depicting Surface Potential (volt), Step Potential (volt), and Touch Potential (volt).
- Also note the Results table depicting Section Nodes and their corresponding values.
- Users can also download the case/report as an excel document or a PDF by clicking the buttons in the upper right corner of the Outputs tab.
- This AC Corrosion Rate table can provide guidance related to the likelihood of AC corrosion based on current density. More information can be found throughout the Theory Guide.
Mitigation
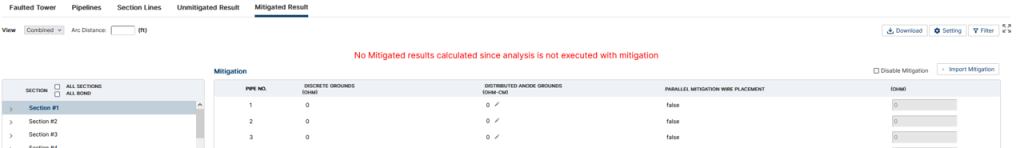
- In the Mitigation section, users can input Discrete Grounds, Distributed Anode Grounds, and Parallel Mitigation Wire Placement as forms of mitigation. The attributes of these can be edited by clicking on their respective fields (or the pencil, in the case of distributed anodes).

- Note that the Mitigation Ground and Pipe Bond Connections table is related to individual sections that are represented in the Mitigation Section column. Users can do each section individually, click the All checkbox to input mitigation for all sections at once, or select multiple sections by holding the Shift key and clicking the desired sections.
- When working with multiple pipelines, boxes can be checked in the Bond Connections section to indicate whether or not two pipes are bonded together.
- The (Ohm) box can be edited to indicate the resistance of the parallel mitigation wire.
- Checking the “Show Existing Mitigation(s)” checkbox on the Map will display the input mitigation based on the legend at the bottom of the map.
- Once the desired mitigation attributes have been input, clicking Calculate will return the user to the Output tab, where users can see the effects of the mitigation on the graphs.
- Note the Show Existing Mitigation(s) checkbox on the Map. Checking this box will display the input Mitigation on the Map based on the legend.
- Users can disable their mitigation, and calculate a steady state case, by clicking the “disable mitigation” checkbox.
FAQ
-
Does ACPT Assess AC and DC Transit System Interference?
Interference voltages and currents from AC and DC dynamic stray power traction systems are not assessed with the ACPT software. This is a question that has been asked multiple times by engineers over the years. The primary reason is interference pickup and leakage currents occur from the tracks to ground as the train moves station to station versus from low voltage power systems. Check Out
-
AC Power Tool (ACPT) Validation?
This is a validation of the Technical Toolboxes ACPT compared to the PRCI model developed by Dr. John Dabkowski. The is a focus study and validation. The data inputs that are recommended for consideration in this type testing as listed below. Check Out
-
ACPT and ACPTGIS versus PRCI AC Mitigation Angles?
ACPT/ACPTGIS uses bearing angles and extends the reference line(s) to come up the intersecting angles with other facilities such as powerlines and pipelines. Check Out
-
ACPT GIS Steady State – Creating Section Lines
Example of a map kmz. or kml. file was imported for both the Power Transmission Line and Pipeline as shown below. Then point and click technology is used to create sections at nodes, towers, proposed mitigation sites, soil resistivity changes, transpositions, etc. Check Out
-
ACPT – Methods Of Soil Resistivity (Barnes Layers)?
Barnes layer data are set up to represent the bulk soil multiple layers for the corrosive layer (pipe depth), deep layer (steady state and inductive fault) and conductive layer (conductive fault). Check Out
-
Fault Current Distribution X/R versus Combined Magnitude?
When a pipeline is located in the vicinity of a power line, it is subject to several electrical effects depending upon the operational status of the line. When a wire carries an electrical current, a magnetic field is produced around the wire which links the buried pipe. Check Out
-
Why the differences in All versus the Closest Tower?
ACPT Fault calculations allow the user to select ALL or a Specific Tower to assess the voltage across coating and the current on the pipe. Why the differences?
- Selecting the closest tower to pipeline results in a more accurate assessment of the fault to the pipeline
- Selecting ALL towers results in a general pattern of the voltages and currents across the length of each segment being assessed. Check Out
-
Estimating AC Voltages and Maximum Current on Power Lines?
The number of data inputs regarding Power Transmission Lines is approximately 25 for Steady State and Fault results. What does this mean is there are infinite combinations that could be run. However, most of them are default values; however, rarely does the client use these default values. Check Out