Introduction
The Level 2 quasi-static analysis has been designed to utilize the results from the PRCI’s hydrodynamic and pipe/soil interaction tests without a full dynamic simulation. Therefore, it can be used to determine weight coating requirements based on more detailed hydrodynamic and soil force formulations than those used in the Level 1 analysis, and in a more simplified manner compared to those used in the Level 3 analysis. It provides the user a simplified method for estimating pipe embedment and the resulting soil resistance. This analysis level is appropriate for preliminary designs, and the resulting concrete thicknesses should be adequate for most final designs.
Calculation Procedure
The Level 2 analysis calculation procedure is depicted in Figure 4-1.

The calculations occur via the following steps:
- Based on user inputs, the software can calculate values for the design wave height spectral density function. The wave height spectral density function is then transformed to a bottom velocity spectral density function. The area under the bottom velocity spectrum is numerically integrated, and the significant bottom velocity is calculated. The peak frequency of the bottom velocity spectrum is determined.
- Maximum and minimum in-line hydrodynamic forces for the largest 200 waves contained in an assumed 4-hour long build-up sea state are calculated (the 4-hour long build-up period is considered to start with a zero wave height and to linearly increase with time to the design sea state wave height, with the sea state model presented in Figure 4-2. The 200 largest waves are characterized by the five wave heights illustrated in Figure 4-3. Wave forces for each of the five wave heights are calculated using the PRCI hydrodynamic force calculation procedure and the associated database of force coefficients.
- Maximum and minimum in-line forces for the largest 50 waves during a subsequent 3-hour long design sea state are calculated as in Step 2 above. These 50 waves are characterized by the four different wave heights illustrated in Figure 4-4.


- Based on the forces calculated in Step 2, a conservative estimate of pipe embedment at the end of the 4-hour storm build-up period is calculated. This estimate is obtained by subjecting the pipe to 200 small oscillations. The oscillations are limited in amplitude to be no larger than that which the wave forces can produce, or 0.07 times the pipe diameter, whichever is smaller. To simulate the build-up sea state, the smaller waves shown in Figure 4-4 are considered first. Not all of the 200 oscillations necessarily produce pipe embedment. Only the waves which produce in-line forces sufficient to overcome frictional resistance between the pipe and soil are considered to produce embedment.
For each of the 200 waves, the in-line hydrodynamic force is reduced to account for the pipe embedment just prior to its application. The estimated pipe embedment and the available soil resistance force at the end of the build-up period are then saved for further processing. Pipe embedment and history dependent soil resistance are calculated using the PRCI pipe/soil interaction model. - Based on the forces calculated in Step 3 and the pipe embedment calculated in Step 4, the amount of additional pipe embedment that can be produced by the 50 largest waves in the design sea state is calculated in a fashion similar to that described in Step 4 for the storm build-up period. This embedment and the associated soil resistance force are saved for further processing.
- Hydrodynamic forces for a complete wave cycle are calculated for four statistically meaningful wave induced bottom velocities that are expected in a 3-hour long design sea state. These waves induced bottom velocities are typical of the largest 135 waves expected during the design event and have been selected to give users indicative information on how stable the pipeline designs are. Each statistical velocity has the possibility that some waves in the design event will exceed it. The four bottom velocities (and the most likely number of wave induced velocities exceeding each) are:
- U1/3 = 1.00 Us; the significant wave velocity (135 exceedances)
- U1/10 = 1.27 Us (40 exceedances)
- U1/100 = 1.66 Us (4 exceedances)
- U1/1000 = 1.86 Us (0 exceedances)
- Using the soil resistance values obtained in Steps 4 and 5 and the hydrodynamic forces calculated in Step 6, the minimum factor-of-safety against lateral sliding is calculated for the pipe embedment at the end of the 4-hour long build-up period, and at the end of the 3-hour long design sea state.
The factor of safety is calculated at one-degree intervals of wave passage for a complete 360-degrees from:
\text{Factor of Safety} = \frac{\mu(W_{S} – F_{L}(t)) + F_{H}}{F_{D}(t) + F_{I}(t)}
\text{Factor of Safety} = \frac{\mu(W_{S} - F_{L}(t)) + F_{H}}{F_{D}(t) + F_{I}(t)}
Where:
- t – Time
- μ – The pipe-soil friction coefficient
- Ws – The submerged weight of the pipe
- FL(t) – The hydrodynamic lift force (as a function of time)
- FD(t) – The hydrodynamic drag force (as a function of time)
- FI(t) – The hydrodynamic inertial force (as a function of time)
- FH – The history-dependent soil resistance
The above procedure was adopted after the results of typical analysis using the Level 3 dynamics software were used to calibrate and confirm that the results for pipe embedment are reasonable and that the results are conservative.
- The pipe embedment developed by the “assumed recent wave history” in steps 2 through 4 above is computed using conservative assumptions which include the following:
- No initial pipe embedment is considered to have occurred until just prior to the design storm,
- A short, 4-hour storm build-up period is assumed to precede the design storm during which some pipe embedment is allowed to occur,
- The significant wave height during the build-up period starts at a zero-wave height and increases linearly with time to the significant wave height of the design storm (see Figure 4-2),
- The pipe is considered to undergo only very small oscillations, and thus does not embed as far as it might otherwise.
Other assumptions specific to the Level 2 analysis tool are as follows:
- Wave induced near seabed water particle velocities are assumed to have a Rayleigh distribution (i.e. similar to the wave height distribution).
- Bottom velocity amplitudes are based on a 3-hour storm duration with input spectral parameters.
- Soil resistance models are available for Sand and Clay soil types based on PRCI pipe/soil interaction model as well as the newly incorporated models for Sand (Verley and Sotberg) and Clay (Verley and Lund). These models include a frictional resistance (dependent on the normal force applied to the soil) and a passive soil resistance (dependent upon pipe embedment and independent of instantaneous pipe normal force).
- Pipe embedment at the end of the storm build-up period is based on 200 small amplitude cyclic oscillations. The amplitude of the oscillations is limited by the hydrodynamic forces expected from a rapidly developing build-up sea state model.
- Subsequent pipe embedment during the design storm is estimated using 50 small amplitude cyclic oscillations of the pipe. The amplitude of these oscillations is also limited by the hydrodynamic force contained in the storm.
These last two assumptions describe the basis for the soil resistance, and detail the conservative estimate of both number and magnitude of oscillations expected to embed the pipe just before the design sea state is encountered. Figure 4-5 shows the logic for determining pipe embedment at the end of the build-up sea state.

Level 2 Input Data Tab
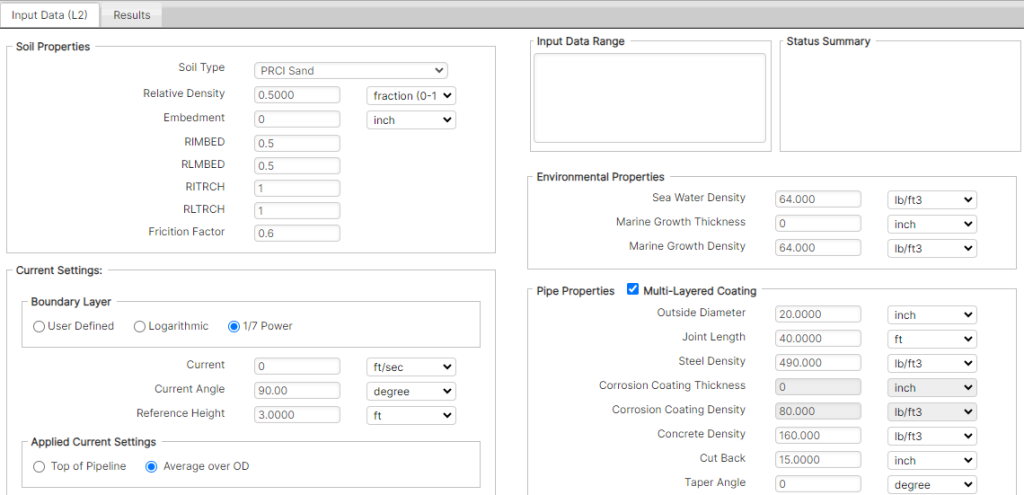
The Input Data tab allows the user to enter all the required parameter values for calculation, as presented in Figure 4-6.
Pipe Properties
Outer Diameter -The outer diameter of the steel pipe.
Wall Thickness – The wall thickness of the steel pipe.
Corrosion Coating Thickness – Thickness of the external corrosion (or insulation) coating.
Corrosion Coating Density – Density of the external corrosion (or insulation) coating.
Concrete Density – Density of the external concrete weight coating.
Field Joint Density – Density of the field joint coating and infill.
Cutback – Cutback in the concrete coating at each end of the pipe joint, as presented in Figure 3-2.
Cutback Taper Angle – Taper angle of concrete coating, referenced from the radial direction, as presented in Figure 3-2.
Product Density – Density of the product/contents inside the pipeline.
Joint Length – The nominal length of one pipe joint.
Steel Density – Density of the steel pipe.
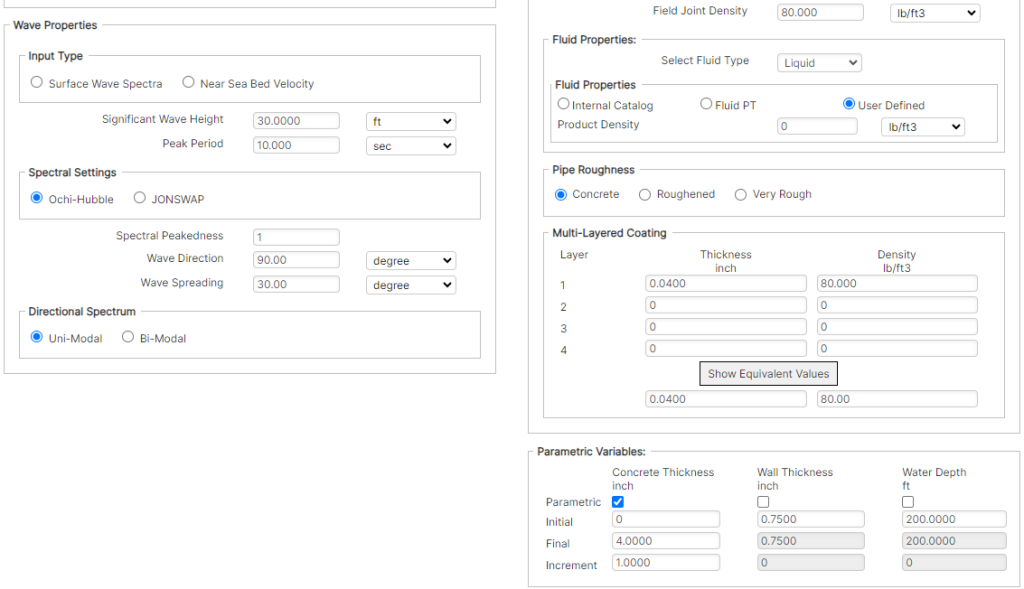
Multi-Layered Coating – If this option is checked, an additional set of input fields appear on the input form under the heading of Multi-Layered Coating, as shown in Figure 4-7. The thickness and density of up to four coating layers can be specified to compute the equivalent coating thickness and density. When using the multi-layered coating option, the standard inputs for the thickness and density of the corrosion coating are disabled, with the calculations using the computed equivalent values instead.

The multi-layered coating section includes the following:
- Layer: numerical index of the coating layer, numbered ascendingly from innermost to outermost layer.
- Thickness: the thickness of each corresponding coating layer.
- Density: the density of each corresponding coating layer.
- Show Equivalent Values: pressing this button calculates and displays the equivalent thickness and density for the coatings specified in the Multi-Layered Coating fields.
Soil Properties
The type of soil is selectable from three options listed under this heading, as presented in Figure 4-8:
- PRCI Sand (cohesion-less soil)
- V&S Sand (cohesion-less soil)
- PRCI Clay (cohesive soil)
- V&L Clay (cohesive soil with the pipe penetration calculated by the Verley and Lund method for clay soil [1])
By default, the selection is set to the first option (i.e. PRCI Sand soil).

Relative Density – This field is available when the selected soil type is PRCI Sand, and characterizes the density of the soil; describing the ratio of the difference between the void ratios of a cohesion-less soil in its loosest state and in situ state to the difference between its void ratio in its loosest and densest states:
D_r=\frac{e_{max}-e}{e_{max}-e_{min}}
D_r=\frac{e_{max}-e}{e_{max}-e_{min}}
Submerged Weight (Level 2) – This field is available when the selected soil type is V&S Sand and is the submerged weight of the Sand.
Cohesive Strength (Level 2) – This field is available when the selected soil type is PRCI or V&L Clay, and describes the magnitude of shear stress the cohesive soil can sustain.
Embedment (Level 2) – Pipe embedment if pipe embedment is to be input rather than calculated.
- Embedment = 0 if software is to calculate embedment
- Embedment > 0 if input value is to be used
RIMBED (Level 2) – The in-line force reduction due to embedment is considered through the RIMBED factor. This factor is the maximum reduction of in-line force obtained at the embedment of 0.5 D or above, as presented in Figure 4-9. The force reduction factor is linearly interpolated between this value and 1 for an embedment less than 0.5 D.

RLMBED (Level 2) – The lift force reduction due to embedment is considered through the RLMBED factor. This factor is the maximum reduction of lift force obtained at the embedment of 0.5 D or above, as presented in Figure 4-9. The force reduction factor is linearly interpolated between this value and 1 for an embedment less than 0.5 D.
RITRCH (Level 2) – This factor reduces the in-line force due to the effect of a trench. The multipliers for trench effects are combined with the multipliers for embedment, so for the example of a pipe at 0.5 D embedment in a trench, a RIMBED value of 0.5 and RITRCH value of 0.8 will reduce the in-line force to 40 % of its unreduced value.
RLTRCH (Level 2) – This factor reduces the lift force due to the effect of a trench. The multipliers for trench effects are combined with the multipliers for embedment, so for the example of a pipe at 0.5 D embedment in a trench, a RLMBED value of 0.5 and RLTRCH value of 0.8 will reduce the lift force to 40 % of its unreduced value.
Current Settings
Boundary Layer – Figure 3-4 presents a typical scenario where a pipeline diameter lies within the steady current boundary layer. Inclusion of current reduction due to its boundary layer can reduce the conservativeness in using free-stream current value.
The following options are provided in the software for the steady current boundary layer calculation (with the formulations below presented for a perpendicular current, for simplicity):
- User Defined: Uses the user defined current velocity as a constant value at the current angle for calculating current load.
U(z)=U_{UD}
U(z)=U_{UD}- Logarithmic: Calculates the current load using a logarithmic relationship, given the current velocity, current angle, current reference height and seabed roughness.
\frac{U(z)}{U(z_r)} = \frac{\ln(z + z_0) – \ln(z_0)}{\ln(z_r + z_0) – \ln(z_0)}
\frac{U(z)}{U(z_r)} = \frac{\ln(z + z_0) - \ln(z_0)}{\ln(z_r + z_0) - \ln(z_0)}
- 1/7th Power: Calculates the current load using the 1/7th power law, given the current velocity, current angle and current reference height.
\frac{U(z)}{U(z_r)}=\left(\frac{z}{z_r}\right)^{\frac{1}{7}}
\frac{U(z)}{U(z_r)}=\left(\frac{z}{z_r}\right)^{\frac{1}{7}}
Current – The speed of the current, which acts at the reference height in the direction specified by the current angle.
Current Angle – The angle of attack at which the current acts on pipeline (perpendicular to the pipe is 90°).
Reference Height – The height above the seabed at which the current value is known (taken as the top of the boundary layer).
Seabed Roughness – Based on the seabed type Seabed roughness value can be input in this field. Reference can made from Table 3-1, as given in DNV-RP-F109 [2].

Applied Current Settings –
Selectable from the following options:
- Top of Pipeline: The applied current velocity is taken as the value calculated at the top of the pipe total diameter (being the pipe OD including all coatings and marine growth).
- Average over OD: The applied current velocity is taken as the average value experienced across the total OD.
Environmental Properties
Seawater Density – Density of the seawater at the pipe location.
Water Depth – Depth of the sea from free surface to the seabed at the pipe location.
Marine Growth Density – Density of the marine growth on the external surface of the pipe.
Marine Growth Thickness (Level 2) – Thickness of the marine growth on the outermost surface of the pipe. This parameter is denoted here as tMG and illustrated in Figure 4-10 without embedment. Due to the various considerations of this parameter in the calculations, this value is treated slightly differently.
- Drag and lift forces: these calculations include consideration of 1·tMG at the top of the pipe, as the dimensional consideration for these parameters is relevant to the vertical pipe profile, with marine growth not being present on the underside of the pipe. Embedment is accounted for by the use of force reduction factors for Level 2 drag and lift.
- Inertia force and submerged weight: these calculations consider a volume that includes 1·tMG circumferentially around the pipe, as the dimensional consideration for this parameter is relevant to the total volume, with the marine growth providing a volume almost equal to a full circumferential layer.
- KC number: the calculation of this value considers a pipe diameter with 2·tMG, as the dimensional consideration for this parameter is relevant to the horizontal pipe profile (i.e. tMG on each side of the pipe).

Pipe Roughness
External roughness ratio of the outermost surface of the pipe, selectable from the following [6]:
- Concrete: smooth concrete coating; k/D = 10-3
- Roughened: a roughened concrete coating (typically resulting from hard bio-fouling, such as barnacles); k/D = 10-2
- Very Rough: further roughened pipe (typically resulting from soft bio-fouling); k/D = 5·10-2
Wave Properties Input Type
The wave type is specified from two options: Surface Wave Spectra and Near Seabed Velocity.
Surface Wave Spectra – The wave is defined by the surface wave parameters, which are used to calculate the wave loads near the seabed:
- Significant Wave Height: the vertical distance from trough to crest of the significant wave.
- Peak Period: the time interval between successive peak wave crests passing a particular point.
Near Seabed Velocity – The wave is defined by the near-seabed parameters:
- Significant Velocity: the velocity of the near seabed wave-induced current.
- Zero-Crossing Period: period of the near seabed wave-induced current.
Wave Properties Spectral Settings
The spectral settings are available for the wave input selection of Surface Wave Spectra.
Ochi-Hubble – This is a general spectrum formulated to describe seas as a combination of two different sea states, using a sum of two Gamma distributions [3]. The Ochi-Hubble spectrum is modelled in the software as a single peak spectrum, and is defined by the following parameters, as presented in Figure 4-11:
- Spectral Peakedness: the dimensionless peakedness parameter for the Ochi-Hubble spectrum.
- Wave Direction: the angle of wave propagation relative to the pipeline (perpendicular to the pipe is 90°).
- Wave Spreading: the standard deviation of wave spreading used in the wrapped normal spreading function.

JONSWAP – This single peak spectrum was initially formulated as a modification of the Pierson-Moskowitz spectrum to describe a developing sea state in a fetch limited situation. It is often applied to on-bottom stability analyses, and is defined by the following parameters, as presented in Figure 4-12.
- Spectral Peakedness: The dimensionless peakedness parameter for the JONSWAP spectrum.
- Sigma A: JONSWAP spectral width parameter, applicable when 𝜔≤𝜔𝑝.
Where:- ω is the wave angular frequency
- ωp is the wave angular spectral peak frequency
- Sigma B: JONSWAP spectral width parameter, applicable when 𝜔>𝜔𝑝.
- Wave Direction: the angle of wave propagation relative to the pipeline (perpendicular to the pipe is 90°).
- Wave Spreading: the standard deviation of wave spreading used in the wrapped normal spreading function.

Wave Properties Directional Spectrum
The directional spectrum settings are available for the wave input selection of Surface Wave Spectra. This area enables characterization of the wrapped normal function used for directional wave spreading, which can be set as either uni-modal or bi-modal.
Uni-Modal – A single directional spectrum is used for wave spreading, as defined by the parameters already assigned in the wave properties spectral settings.
Bi-Modal – Two directional spectra are used for determining wave spreading. The following additional inputs are required to define the bi-modal spreading, as presented in Figure 4-13:
- Secondary Direction: the secondary mean direction for wave spreading relative to the pipeline (perpendicular to the pipe is 90°).
- Secondary Spreading: the secondary standard deviation of wave spreading used in the bi-modal wrapped normal spreading function.
- Mixing Constant: the value used to combine the two components of the bi-modal directional spectrum, termed a in the following:
D(\Theta)=aD_1(\Theta)+(1-a)D_2(\Theta)
D(\Theta)=aD_1(\Theta)+(1-a)D_2(\Theta)

Parameters Variables
This section facilitates parametric stability analyses that involve iteration over a single parameter, or over combinations of multiple parameters. The parametric analyses are available for concrete thickness, pipe wall thickness, and water depth.
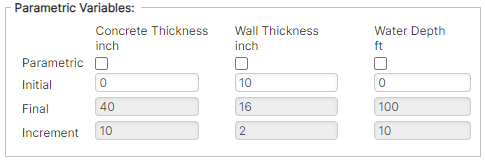
The default configuration for this area is for all variables as single values, with the parametric analysis being opt-in for each, as shown in Figure 4-14. With the parametric study of a variable being disabled, the value input for the Initial field is used in the calculations as the single value for that variable, in the same manner as for the other variables on the Input Data tab.
The parametric analysis for a variable is enabled via the checkbox in its column, which enables the specification of the Final and Increment values, as shown in Figure 4-15. The inputs specified are then:
- Initial: the starting value for the parameter incrementing, which represents its minimum value.
- Final: the ending value for the parameter incrementing, which represents its maximum value.
- Increment: the value at which the parameter is incremented, from Initial value to Final value. The incremented values appear as separate entries in the outputs.

Level 2 Output Data Tab
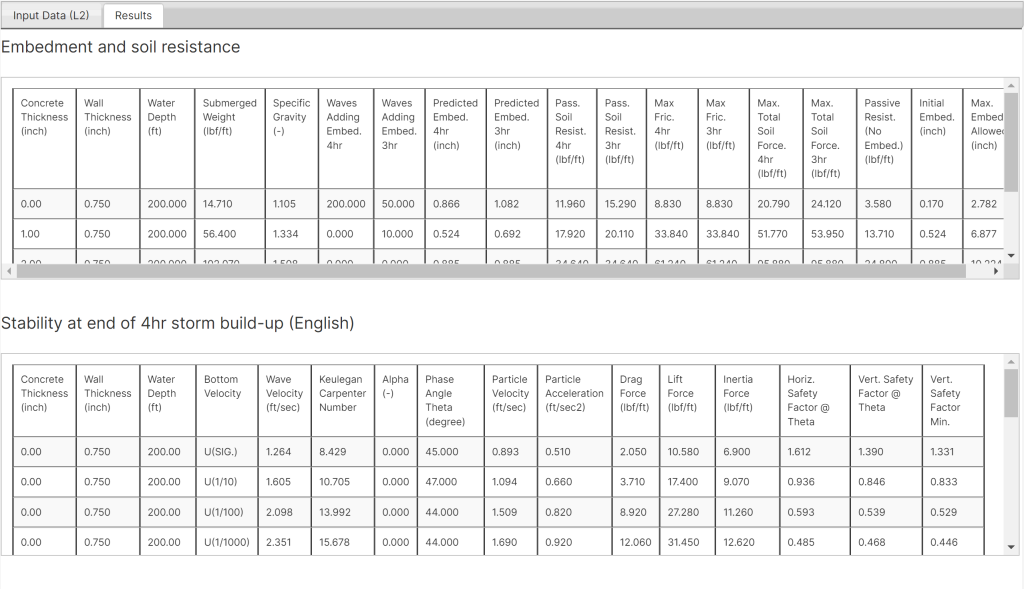
The output can be viewed by clicking the Output Data (L2) tab, which displays the results outlined in this section in the chosen unit system, as presented in Figure 4-16.

Embedment and Soil Resistance
Concrete Thickness – Displays the range of concrete thickness in the increments defined in the Input Data tab, with the first and last values in this column being the initial (minimum) and final (maximum) concrete thicknesses.
Submerged Weight – This column displays the submerged weight of the pipe, calculated for the respective concrete coating thickness in the leftmost column.
Specific Gravity – The ratio of the coated pipe density for the respective concrete coating thickness to the density of seawater.
Waves Adding Embedment 4hr/3hr – The number of waves that contribute to pipe embedment when the pipe is subjected to 4-hour storm build-up and 3-hour design storm following the 4-hour build-up periods, respectively.
Predicted Embedment 4hr/3hr – The embedment predicted of the pipe into the soil after being subjected to 4-hour storm build-up and 3-hour design storm following the 4-hour build-up periods, respectively.
Passive Soil Resistance 4hr/3hr -The passive soil resistance that is generated after the pipe is subjected to 4-hour storm build-up and 3-hour design storm following the 4-hour build-up periods, respectively.
Maximum Friction 4hr/3hr – Maximum friction force generated after the pipe is subjected to 4-hour storm build-up and 3-hour design storm following the 4-hour build-up periods, respectively.
Maximum Total Soil Force 4hr/3hr – The maximum total horizontal soil force generated after the pipe is subjected to 4-hour storm build-up and 3-hour design storm following the 4-hour build-up periods, respectively. This value is the summation of the passive soil resistance and the friction force.
Passive Resistance (No Embedment) – The passive soil resistance without considering any pipe embedment.
Initial Embedment -The pipe embedment under initial conditions (i.e. before the application of any storm periods). The value is either calculated by the software or as input by the user; depending on the specification of the embedment inputs.
Maximum Embedment Allowed – Describes the upper limit that the embedment can reach. This value is dependent on parameters such as pipe dimensions and weight, and is calculated using different methods depending on the soil model.
Stability Results for 4hr Storm Build-up / Additional 3hr Storm
The results for the end of the 4-hour storm build-up and for the end of additional 3-hour storm are presented in separate tables, with outputs as described in this section.
Concrete Thickness – Displays the range of concrete thickness in the increments defined in the Input Data tab, with the first and last values in this column being the initial (minimum) and final (maximum) concrete thicknesses.
Bottom Velocity – The four different bottom velocity categories, for which all the calculations are carried out, are presented in separate rows in this column:
- USIG.: the velocity associated with the significant wave
- U1/10: the velocity calculated from the mean height of the highest one-tenth of the waves; = 1.27 USIG
- U1/100: the velocity calculated from the mean height of the highest one-hundredth of the waves; = 1.66 USIG
- U1/1000: the velocity calculated from the mean height of the highest one-thousandth of the waves; = 1.86 USIG
Wave Velocity – Velocity of the near seabed wave including the effects of spreading.
Keulegan-Carpenter Number – The Keulegan-Carpenter number calculated for each respective wave velocity and concrete thickness.
Alpha – The current to wave ratio calculated for each respective bottom velocity
Phase Angle Theta – The wave phase angle at which the minimum horizontal stability occurs.
Particle Velocity – The summation of the wave and current velocities acting at the pipe depth, for the phase angle.
Particle Acceleration – The normal particle acceleration acting at the pipe depth, for the phase angle.
Drag Force – The drag force corresponding to the particle velocity presented.
Lift Force – The lift force corresponding to the particle velocity presented.
Inertia Force – The inertia force corresponding to the particle acceleration presented.
Horizontal Safety Factor at Theta – The minimum horizontal safety factor encountered across the full sweep of wave phase angle (which corresponds to the phase angle presented). It is the quotient of the available soil resistance divided by the sum of the horizontal forces.
Vertical Safety Factor at Theta – The vertical safety factor corresponding to the phase angle presented. It is the quotient of the pipe weight divided by the lift force.
Vertical Safety Factor – The minimum vertical safety factor encountered across the full sweep of wave phase angle, often not at the phase angle presented previously for the minimum horizontal safety factor.
Level 2 Reports
Similar to Level 1, once the analysis is completed a PDF file report would also be created. This file can be accessed through the Report button option in the ribbon menu. An instance of input and output pages of Level 2 report are shown in Figure 4-17 and Figure 4-18, respectively.


Level 2 Plots
Control of the generation, viewing and printing of output data plots for the Level 2 analyses is facilitated by the options in the Plots drop down list, as presented in Figure 4-19. Each of the plot menu items opens a window to display the selected plot, with various view options.

Hor. Factor of Safety Plot
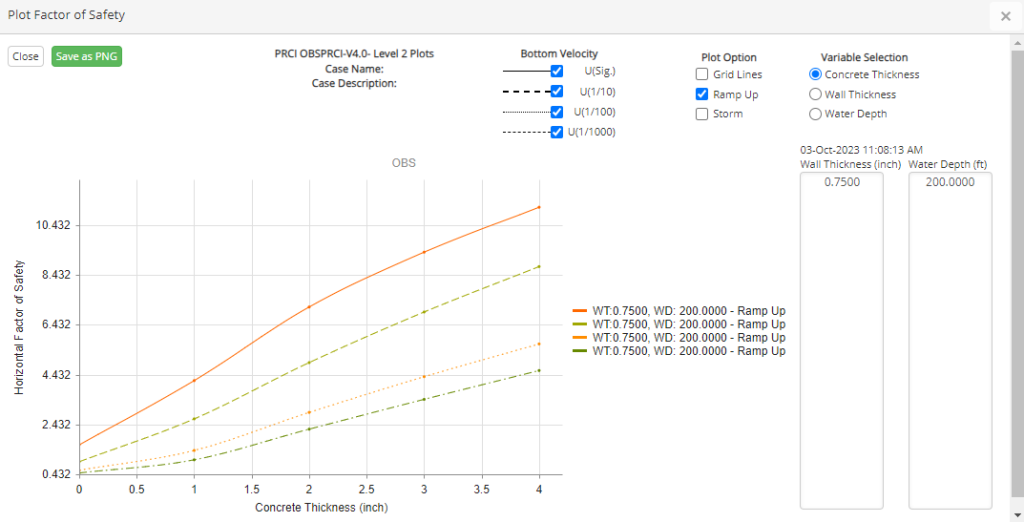
This plot displays the Horizontal stability factor of safety as a function of the various parametric input ranges, as presented in Figure 4-20. The plot shows various lines that present the Horizontal safety factor values, based on the selection of options for bottom velocity, primary variable selection (which sets the parameter of focus, plotted on the x-axis), and secondary variables (where curves can be restricted to specific combinations of inputs only).
The plot window has options to Close the plot window, Save as PNG the plot, and show/hide grid lines.
Ver. Factor of Safety Plot
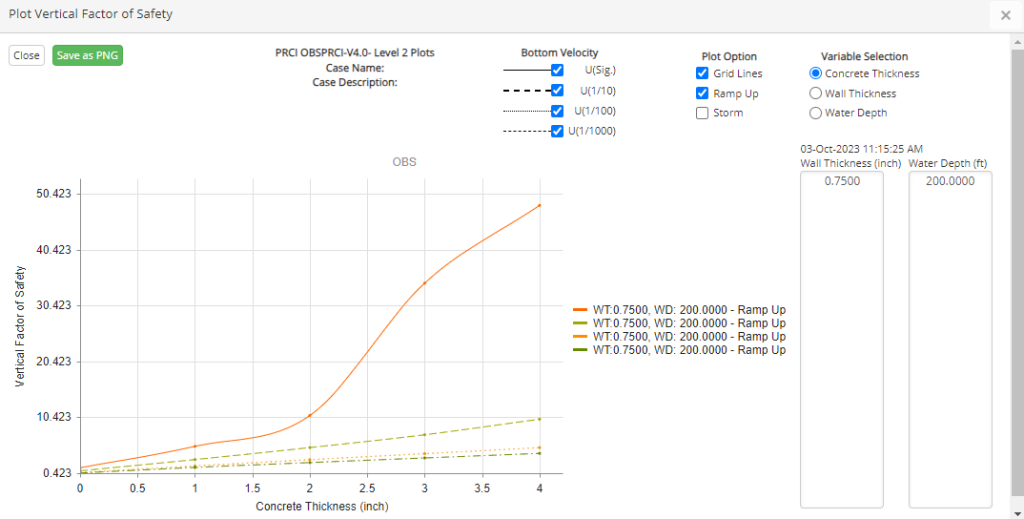
This plot displays Vertical Stability Factor of Safety as a function of the various parametric input ranges, as presented in Figure 4-21. The plot window has similar features as Hor. Factor of Safety.
Embedment Plot
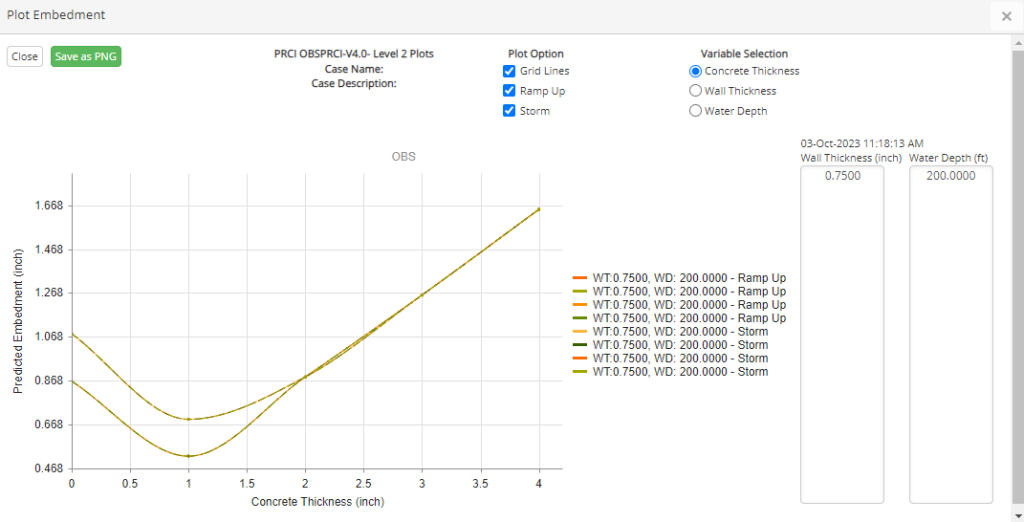
This plot displays the pipe embedment as a function of the various parametric input ranges, as presented in Figure 4-22. The plot shows various lines that present the embedment values based on the selection of options for bottom velocity, primary variable selection (which sets the parameter of focus, plotted on the x-axis), and secondary variables (where curves can be restricted to specific combinations of inputs only). The plot window has options to Close the plot window, Save as PNG the plot, and show/hide grid lines.
References
- Verley, R. L. P. and Lund, K. M. A Soil Resistance Model for Pipelines Placed on Clay Soils, OMAE – Volume 5, 1995
- DNV-RP-F109, On-Bottom Stability Design of Submarine Pipelines, Det Norske Veritas, Nov-2011
- Ochi, M. K. Hubble, E.N. Six-parameter wave spectra, Proceedings 15th International Conference on Coastal Engineering, Honolulu, 1976
- DNV-OS-F101, Submarine Pipeline Systems, Det Norske Veritas, Oct-2013
- On-Bottom Stability in Deep Waters Note, Det Norske Veritas
- Catalog No. L51522e, PR-170-185, Hydrodynamic Forces on Pipelines: Model Tests, Prepared for PRCI by the Danish Hydraulic Institute, Dec-1986
- PR-170-716, Hydrodynamic Forces Acting on a Pipeline in an Open Trench, Prepared for PRCI by the Danish Hydraulic Institute, Jan-1988
- Ochi, M. K. and Hubble, E.N. Six-Parameter Wave Spectra, Proceedings 15th International Conference on Coastal Engineering, Honolulu, 1976
- Mardia, K. V., Statistics of Directional Data. London: Academic Press, 1972
- Borgman L.E., Directional Wave Spectra from Wave Sensors. In: Earle M.D., Malahoff A. (eds) Ocean Wave Climate. Marine Science, vol 8. Springer, Boston, MA, 1979
- Mardia, K.V., Some properties of clasical multi-dimesional scaling,Communications in Statistics – Theory and Methods, 1978
- PR-169-186
- PR-175-420
- Catalog No. L51570e, Contract PR-194-719, Energy Based Pipe-Soil Interaction Models, PRCI, June 1988
- PR-162-157
- PRCI Project PR-178-04405, Submarine Pipeline On-Bottom Stability Volume 1: Analysis and Design Guidelines, Kellogg Brown & Root, Inc., Dec-2008
- PRCI Project PR-178-04405, Submarine Pipeline On-Bottom Stability Volume 2: Analysis and Design Guidelines, Kellogg Brown & Root, Inc., Dec-2008
- Abdolmaleki, K. and Gregory, C. J., Performance of Pipe-Soil Interaction Models in a Quasi-Dynamic Approach to Pipeline Stability Analysis, OMAE-77988, 2018, Spain
- Jacobsen, V., Bryndum, M.B., and Bonde, C., “Fluid Loads on Pipelines: Sheltered or Sliding,” Proc. 21st Offshore Technology Conference, Paper No. OTC 6056, Houston, 1989
FAQ
-
Can OBS accurately model for HDPE Pipe?
Except for the Level 3, the software can be used for stability assessment of HDPE pipes.
The level 3 uses a beam-element type of finite element approach that takes the stiffness of the pipe into account. However, the software has only been applied to steel pipes and no validation has been conducted on using Level 3 for analysis of flexible pipes.
Therefore, it is not recommended to use Level 3 at this stage. Check Out
-
What is the reference height of current velocity in Level 3?
The reference level for current input in Level 3 is the elevation of the top of the pipe, including any coatings, and assuming no embedment.
The theory used to convert specified currents to the elevation of the top of pipe is at the discretion of the user. Check Out
-
Does OBS have a water depth limitation?
In the PRCI OBS V3.0, the software could not receive water depths less than 6m.
In the PRCI OBS V4.0, this restriction has been removed and users can input any water depth. However, the applied theory has not been revised is still based on linear wave theory.
Therefore, it is the users’ responsibility to ensure that ratio between the inputted wave data at the given water depth does not exhibit very nonlinear / breaking wave scenario. Check Out
-
What is lateral factor of safety in Level 2?
“Lateral factor of safety” means Horizontal Safety Factor at Theta.
The vertical factor of safety is computed but ignored. It is not significant if the pipe moves up and down slightly so long as it does not move horizontally as determined by the horizontal safety factor calculation.
Pipeline stability for Level 2 analysis requires that at the end of 4 hr storm buildup the horizontal safety factor at theta for U(1/100) must be 1 or greater and that at the end of the additional 3 hr storm the horizontal safety factor at theta for U(1/1000) must be 1 or greater. Check Out
-
What is the meaning of Factor of Safety in Level 3?
This is the momentary ratio of hydrodynamic force and lateral resistance at each time history. Check Out
-
In Level 3, can factor of safety be used as a Pass/Fail criteria like Level 2?
Currently, no way has been found to use the factor of safety as calculated in Level 3 as a pass/fail criterion like Level 2. Check Out
-
When does hydrodynamic ramping force apply for Level 3?
Consult section 5.8.4 from the version 4.0 User’s Manual:
Ramping force begins at t=0. To simulate slowly built-up dynamic forces use a “Build-up sea-state ramp” of 12 or less. Check Out
-
What is the general guidance on usage of Level 3?
Preliminary stability analyses should be completed using Level 2 or the ASM module, so as to have a good starting point for a Level 3 stability analysis.
- For each pipe outer diameter and weight, sufficient runs need to be made with different “seeds”. Random seeds are numbers used as internal input to generate random irregular sea states, with two different seed values resulting in two different sea states. Performing the analysis with a sufficient number of storm simulation seeds provides a reliable indication of the range of results which may be obtained for the specified wave spectrum parameters. Check Out
-
Can I use OBS Level 2 or 3 to assess stability of power cables of wind turbines at crossings areas?
No.
From the embedment point of view, it is realistic to assume that the cable has zero embedment, but the limitation of OBS is that it cannot capture the influence of free span zones on the cable’s lateral stability. Check Out
-
In Level 2, if the horizontal factors are shown as >1 but the vertical are <1, is the pipeline considered stable?
The software produces two vertical safety factors. One is corresponding to the minimum horizontal safety factor at wave angle “Theta” and the other one is the independently minimum vertical safety factor.
The lateral soil resistance includes a passive component, which is solely dependent on the pipe embedment.
In scenarios where lift force momentarily gets larger than the Submerged weight, the vertical safety factor < 1 and the pipe might lose contact with seabed, however, the embedment related component of the passive soil can remain nonzero. Check Out
-
PRCI OBS V3.0 Illegal Operation! Message
If you receive an Illegal Operation! message when switching between Levels, this could provide a workaround for you. Check Out
-
OBS V4.0 Error Contacting Registration Service Message
If you are trying to activate OBS Version 4.0 and receive an error message, this quick guide should help us gauge where the root of the issue is and how best to resolve this for you. Check Out
