
[chatbot-1]
Objective
The User Guide for the AC Mitigation PowerTool’s Fault Current module serves to guide the user through modeling and mitigating AC corrosion under fault current conditions. This guide will cover creating and importing pipeline data, through modeling the effects of AC current on the pipeline, along with inputting and modeling the effects of mitigation on the pipeline.
Note: For further information related to the theory behind AC interference and mitigation, please refer to the AC Mitigation PowerTool Theory Guide. Certain terms in the AC Mitigation PowerTool (ACPT) User Guide are hyperlinked to corresponding sections of the Theory Guide for ease of access. Some of these terms may also be expanded upon in multiple sections of the Theory Guide.
Getting Started
Prior to initiating the Fault Current module in the AC Mitigation PowerTool, the user must build a case in the Steady State module with the associated pipeline(s) and power line(s). To facilitate this process, users can access the AC Mitigation PowerTool Steady State User Guide. Once the case has been built, users should create a New Case in the AC Mitigation Fault Current module and import the Steady State case’s data by selecting it in the dropdown next to the Steady State Case field, and then clicking on the ![]() button.
button.
Faulted Tower
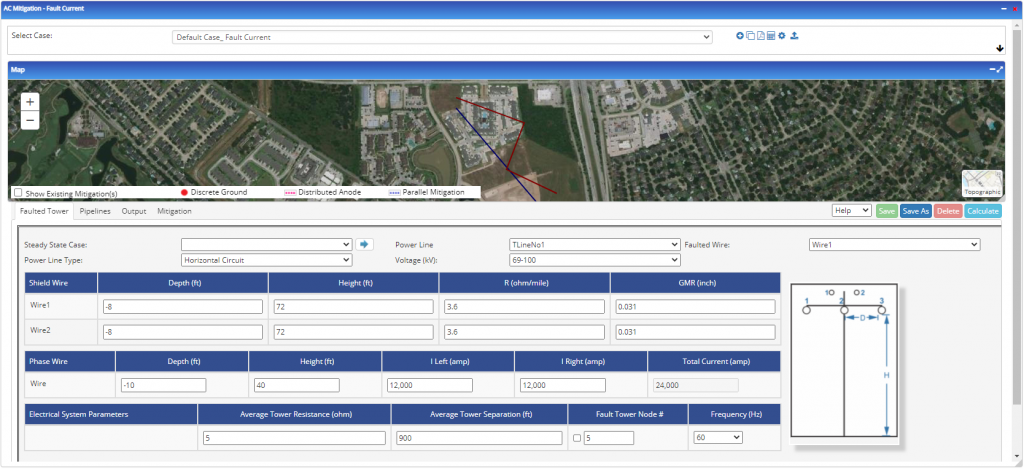
After importing the Steady State case, users should ensure that the data in each field is accurate. Specifically, users should ensure that the correct wire is designated in the Faulted Wire field and that the Power Line Type is accurate.
- For assistance in determining the I Left (amp) and I Right (amp) and Average Tower Separation values, refer to the Tower Circuit Fault Voltages and Currents Table in the Theory Guide.
- If Average Tower Resistance (ohm) is unknown, it is recommended to use a value of 10 ohms.
- Fault Tower Node # corresponds to the sections created in the Pipeline tab initially created in the Steady State Module. Note that Pipeline Sections can be edited in the Pipelines tab of the Fault Current Module as well. Specifying a Tower Node # denotes at which section/node the fault has occurred. This feature allows the user to analyze the sections/nodes in a more granular way. It is recommended to use the All option by default. When a user specifies a tower node, an orange dot appears at the corresponding location on the ACPT Map.
Pipeline
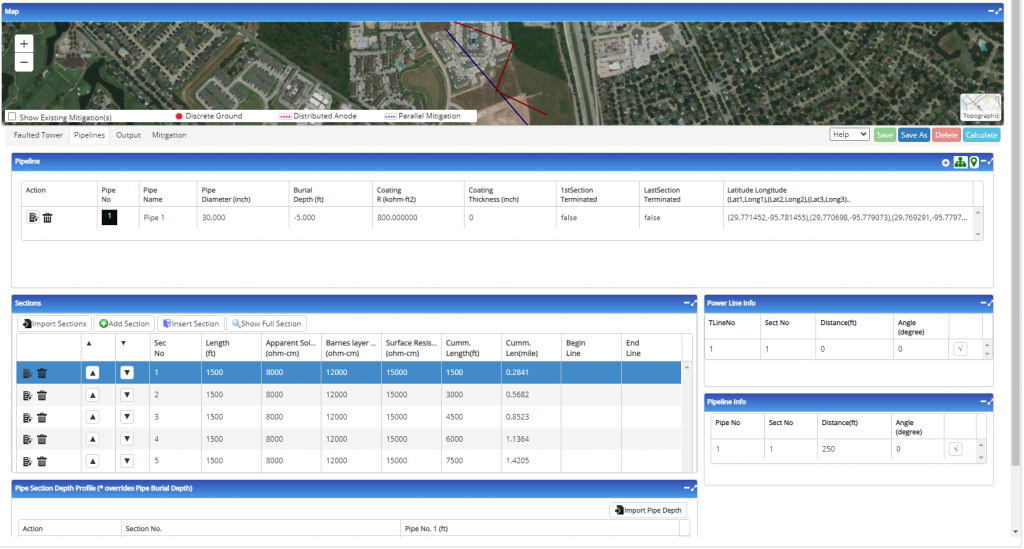
- The Pipeline data has been imported from the associated Steady State case.
- Users should review all fields to ensure that they contain the appropriate data, and modify any that they wish to change using the
 button.
Output
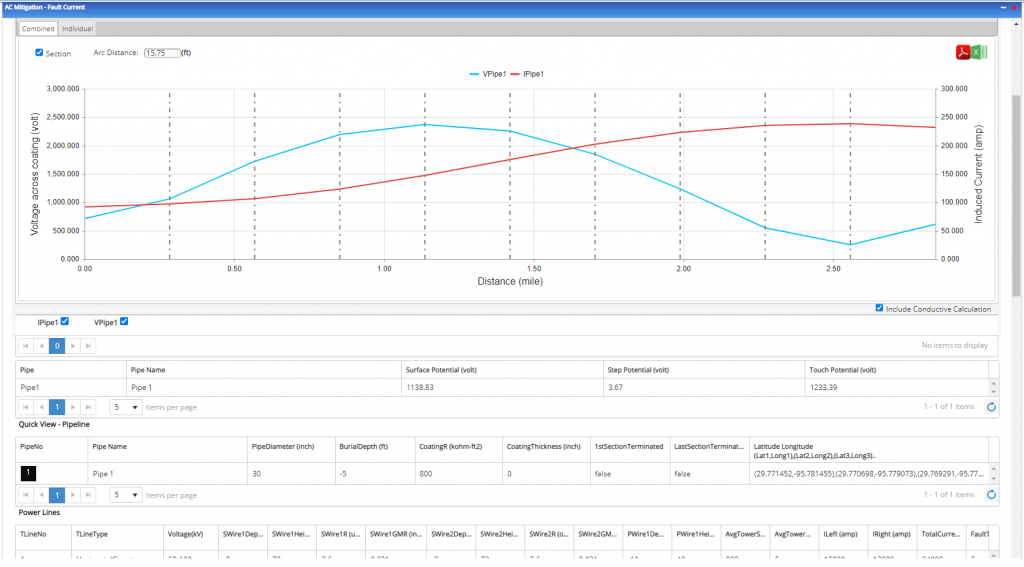
- To populate the Output tab once the Pipeline sections have been generated, click on the Calculate button in the bottom right of the map.
- In the Output section, users can view the induced voltages (blue line, labelled VPipe), induced current (red line, labeled IPipe), and AC current density (green line, labeled IACPipe) on the pipelines either on individual graphs or combined into one graph.
- Users can also toggle the Section designations on or off by selecting or de-selecting the check box next to Section.
- Additionally, users get Quick View versions of the Sections, Results, Mitigation, Bond Connections, and Pipe Length Depth in this tab.
- Note the additional pipe table depicting Surface Potential (volt), Step Potential (volt), and Touch Potential (volt).
- Also note the Results table depicting Section Nodes and their corresponding values.
- Users can also download the case/report as an excel document or a PDF by clicking the buttons in the upper right corner of the Outputs tab.
- This AC Corrosion Rate table can provide guidance related to the likelihood of AC corrosion based on current density. More information can be found throughout the Theory Guide.
Mitigation
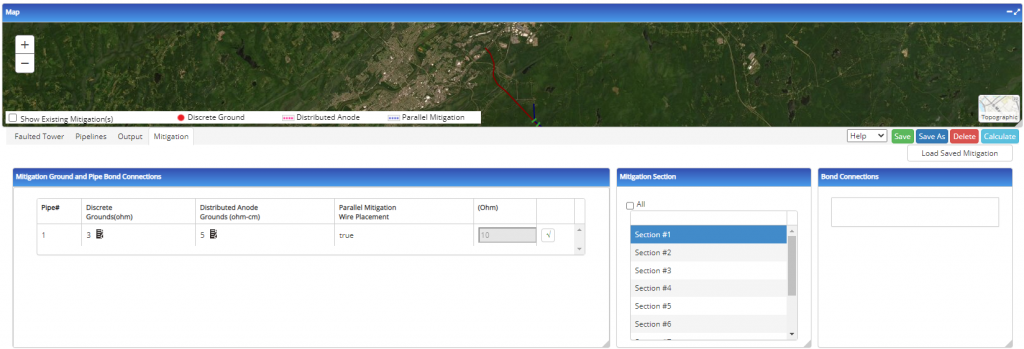
- In the Mitigation section, users can input Discrete Grounds, Distributed Anode Grounds, and Parallel Mitigation Wire Placement as forms of mitigation. The attributes of these can be edited by clicking on the button. Note that the Mitigation Ground and Pipe Bond Connections table is related to individual sections that are represented in the Mitigation Section column. Users can do each section individually, click the All checkbox to input mitigation for all sections at once, or select multiple sections by holding the Shift key and clicking the desired sections.
- When working with multiple pipelines, boxes can be checked in the Bond Connections section to indicate whether or not two pipes are bonded together.
- The (Ohm) box can be edited to indicate the resistance of the parallel mitigation wire.
- The Load Saved Mitigation button restores the previous mitigation settings in the event that users are experimenting with different permutations of mitigation and wish to quickly revert to the previous settings.
- Checking the “Show Existing Mitigation(s)” checkbox on the Map will display the input mitigation based on the legend at the bottom of the map.
- Once the desired mitigation attributes have been input, clicking Calculate will return the user to the Output tab, where users can see the effects of the mitigation on the graphs.
- Note the Show Existing Mitigation(s) checkbox on the Map. Checking this box will display the input Mitigation on the Map based on the legend.
Related Links
Table of Contents
Table of Pages
- Pipeline HUB User Resources
- AC Mitigation PowerTool
- API Inspector's Toolbox
- Crossings Workflow
- Horizontal Directional Drilling PowerTool
- Hydrotest PowerTool
- Pipeline Toolbox
- PRCI AC Mitigation Toolbox
- PRCI RSTRENG
- RSTRENG+
- Ad-hoc Analysis
- Database Import
- Data Availability Dashboard
- ESRI Map
- Report Builder
- Crossings Workflow
- Hydrotest PowerTool
- Investigative Dig PowerTool
- Hydraulics PowerTool
- External Corrosion Direct Assessment Procedure - RSTRENG
- Canvas
- Definitions
![]()
HAVE A SUPPORT QUESTION?
- 7136300505