RSTRENG+
Zero Out Method
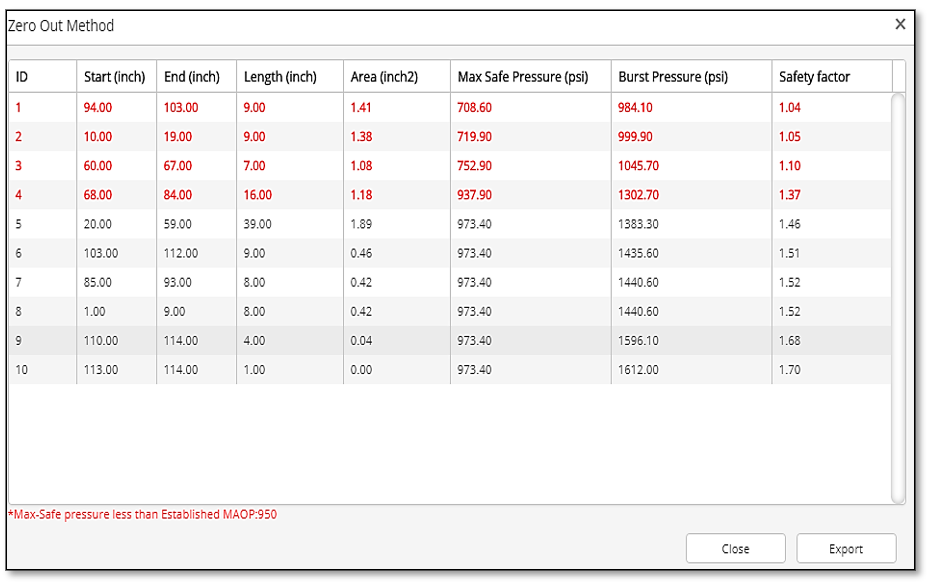
 The zero-out method (ZOM) data is available to be viewed in a separate screen which is also available for export to an excel spreadsheet to be compared with data post-execution of the zero-out method.
See top menu ![]() Zero Out Method Table as shown below. These results are from the calculations using RSTRENG.
Zero Out Method Table as shown below. These results are from the calculations using RSTRENG.
It should be noted that this pipeline example is a 0.72 design with a safety factor of 1.39. This table can assist the pipeline operator in the determination of making the appropriate repairs with composite/steel sleeves to bring the pipeline to a safe operating pressure. Most operators use the combination of safety factors and max safe operating pressure to make critical engineering assessments (ECAs).
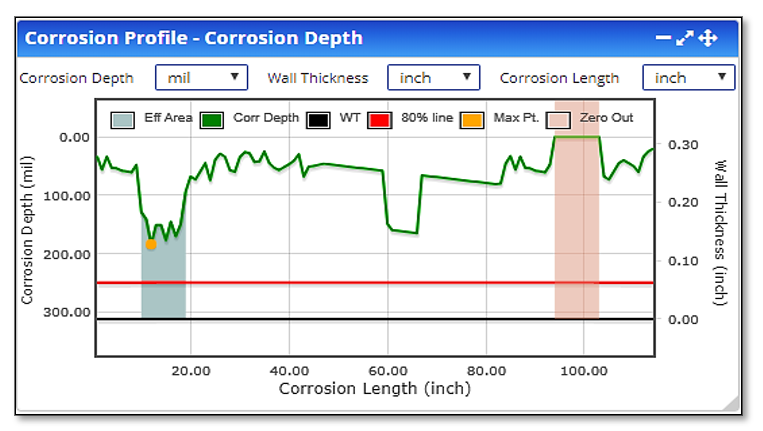
Zero Out effective area on the graph using the profile bar is displayed in the image below.
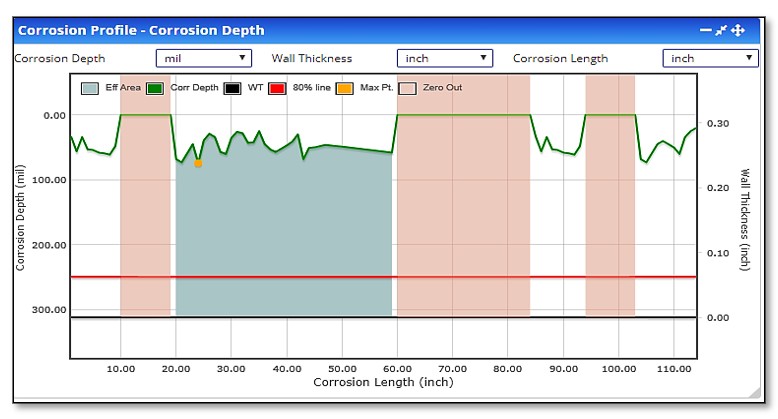
The image below represents an RSTRENG© plot when the above case is re-calculated until all areas are to be repaired.

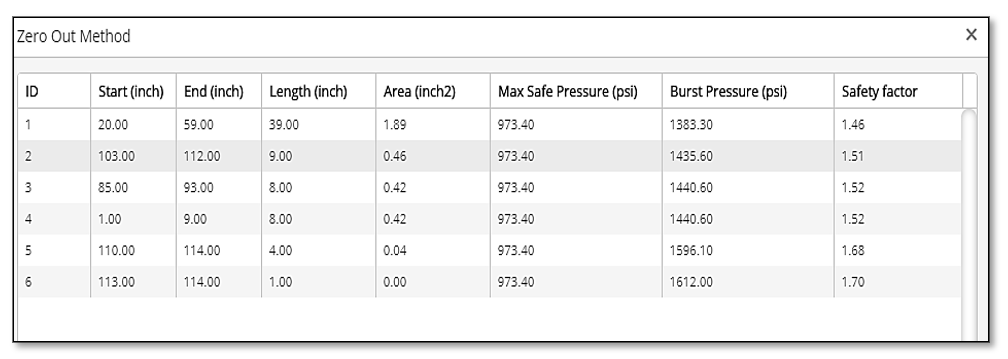
Results of Zero Out Method Table with repairs made shown below:

It should be noted that the user has the option to keep running the Zero Out Method PRCI RSTRENG 2.7 Intro_6.png(Single Method) until the desired Safety Factor and Max Safe Pressure meets their criteria for safety. For example, there could be safety concerns such as a geotechnical issue or a dwelling that is too close.
Additional Resources
Technical Toolboxes offers training webinars on these upgrades as well as RSTRENG© on-site training with certification. RSTRENG© training courses are also offered with defect analysis understanding from one half-day, one day, and one 1/2 days depending on your needs. Review our website under the Training section to sign up for these courses.
For support and other software questions, please check out the Support Tab on the Technical Toolboxes Website or our Support Desk Portal.
References
- PRCI – A Modified Criterion for Evaluating the Remaining Strength of Corroded Pipe
- PRCI – Database of Corroded Pipe Tests
- PRCI – Continued Validation of RSTRENG
- For additional information please see reports that are furnished by Pipeline Research Council International, Inc. (PRCI) using the following link. https://www.prci.org/Research/Corrosion/CORRProjects/EC-6-1/4153/15495.aspx
- NACE Standard RPO102 (latest revision), “In-Line Inspection of Pipelines” Houston, TX
- NACE Standard RP0313 (latest revision), “Guided Wave Applications for Pipelines”, Houston, TX
- NACE Standard RP0502 (latest revision), “Pipeline External Corrosion Direct Assessment Methodology”, Houston, TX
- ASME B31.8 (latest revision), Gas Transmission and Distribution Piping, New York, New York
- ASME B31.8S (latest revision), Gas Transmission and Distribution Piping, New York, New York
- ASME B31.G (latest revision), ASME B31G – Manual for Determining the Remaining Strength of Corroded Pipelines (RSTRENG), New York, New York
Appendices
- Remaining Strength of Corroded Pipe (RSTRENG) Assessment Procedure, Joe Pikas
- Preventative Measures to Control Corrosion Pitting, Joe Pikas
