The Model Viewer window is shown in the image below. The Model Viewer can be used to perform a sense-check on the input data and spot any unusual behavior. The different areas of the Model Viewer are explained in the following sections.
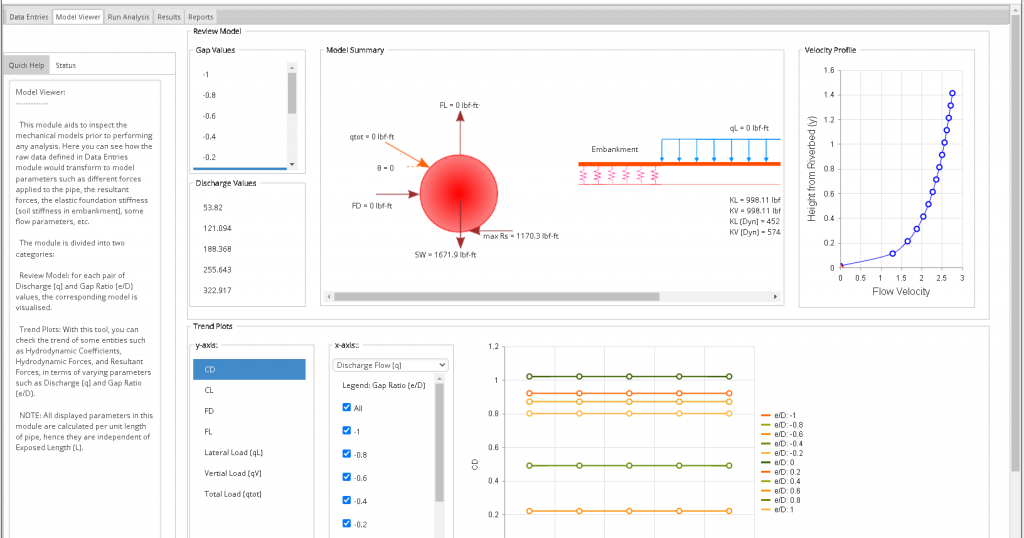
Review Model
The model summary and velocity profile for selected gap value and river discharge can be viewed in this section. Gap and discharge values have been calculated based on the min/max and number of increments provided by user for each parameter.
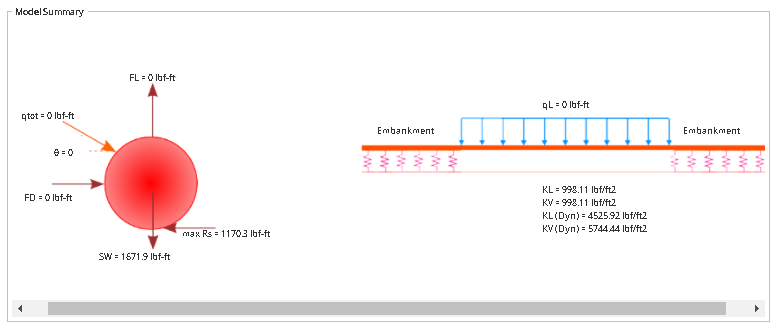
The following parameters calculated by the program are shown in the Review Model section:
- Total load (qtot)
- Total load angle (θ)
- Hydrodynamic drag load (FD)
- Hydrodynamic lift load (FL)
- Total submerged weight of pipe including all external coatings and content (SW)
- Soil reaction per unit length (Rs)
- Lateral load on pipeline (qL)
- KL: Static lateral soil softness
- KV: Static vertical soil stiffness
- KL (Dyn): Dynamic lateral soil stiffness
- KV (Dyn): Dynamic vertical soil stiffness
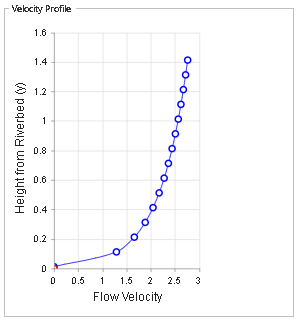
The velocity profile is shown at the right-hand side of the Review Model. The red circle is representative of the selected gap and discharge values.
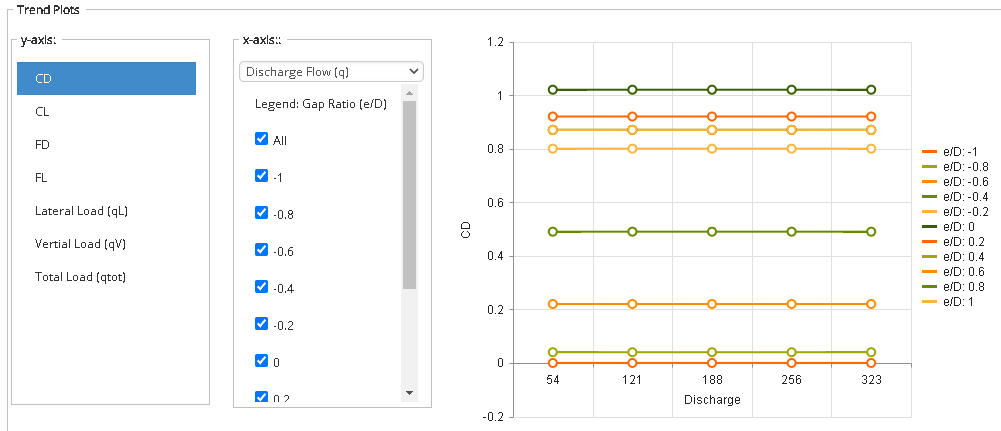
Trend Plots
The trend plots are shown at the bottom of the Model Viewer Module.
The following options are available for x-axis, y-axis, and legend:
- Y-axis
- CD: Hydrodynamic drag coefficient
- CL: Hydrodynamic lift coefficient
- FD: Hydrodynamic drag load
- FL: Hydrodynamic lift load
- qL: Lateral load on pipeline
- qV: Vertical load on pipeline
- Qtot: Total load
- X-axis:
- Gap Ratio (e/D)
- Discharge Flow (q)
- Legend:
- Gap Ratio (e/D)
- Discharge Flow (q)
It is noted that the legend parameter is selected automatically based on the x-axis parameter. Plots for multiple sections can be shown by ticking the provided checkboxes (see image below).