There are four (4) types of importing lat./longs and ArcGIS data
- Shape Files (shp.)
- Map File (kmz. & kml.)
- Create from GIS
- Excel
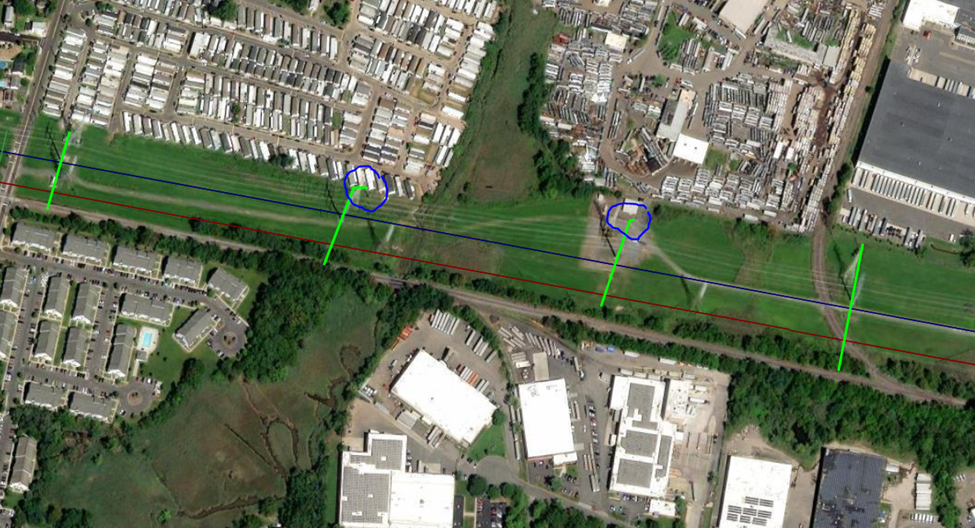
Example of a map kmz. or kml. file was imported for both the Power Transmission Line and Pipeline as shown below. Then point and click technology is used to create sections at nodes, towers, proposed mitigation sites, soil resistivity changes, transpositions, etc.,
Once this is completed, the user can calculate sections, distance, and angles.
The ACPT automatically calculates:
- Proximities to each structure
- Angles to each structure
- Section lengths based on engineering criteria
- Depth of cover (DOC) imported to each section as needed
This work flow allows the user to import large data sets quickly for pipelines and AC transmission lines. By using Point and Click which sets up sections within minutes and identifies AC threats immediately start design mitigation strategies. If you need to put in an additional section or sections, just go back to an insert additional section lines with no limitations.
However, from time to time, a small tail is created with a slow mouse as shown below in the blue circle. This must be deleted and a new one created as shown on either end of the map. Otherwise, the tail may have its own sections with no contact to the pipeline or powerline. This will create an error during the calculation of the angles and distances.