Introduction
Sensitivity analysis under the Advanced Calculation options is dedicated to exploring how changes in the inputs of a calculator ultimately change the model’s results. This methodology allows engineers to assess how sensitive underlying operating parameters are, allowing for a better understanding of what parameters are most important for making a pipeline safe and compliant with government standards. In our sensitivity analysis workflow, users choose the input parameters they want to study, defining a range of values that those parameters should span. Sensitivity analysis then takes those inputs, and evaluates a pass/fail criteria for each of the cases the user provides. This gives the user information to determine which inputs are most responsible for the integrity of their pipeline, and how much changing those parameters ultimately affects the pass/fail criteria.
Sensitivity analysis version 2 now allows the user to automate the entire sensitivity analysis workflow. The model is now equipped a decision tree which helps the user define the study parameters, provides heatmaps, and study profiles for easy analysis.
Pipeline Crossing
Sensitivity Analysis feature is currently available for the following calculations in the pipeline crossing module under PLTB – Gas & Liquid
- API 1102 – Pipeline Crossing Highway
- API 1102 – Pipeline Crossing Railroad
- Track Load Analysis
- Wheel Load Analysis
- CEPA Wheel Load
- CEPA Track Load
- CEPA Grid Load
- GPTC Guide Appendix G192-15- Design of Uncased
HDD PowerTool
Sensitivity Analysis feature is now available in HDD PowerTool module in the following calculations
- Steel Pipe: Pull force & installation stresses – Vertical
- Steel Pipe: Pull force & installation stresses – Vertical and Horizontal Plane
- Polyethylene Pipe: Pull Force & Installation Stress
- Polyethelene Pipe: Pull Force and Installation Stresses (Specific Radius of Curvature)
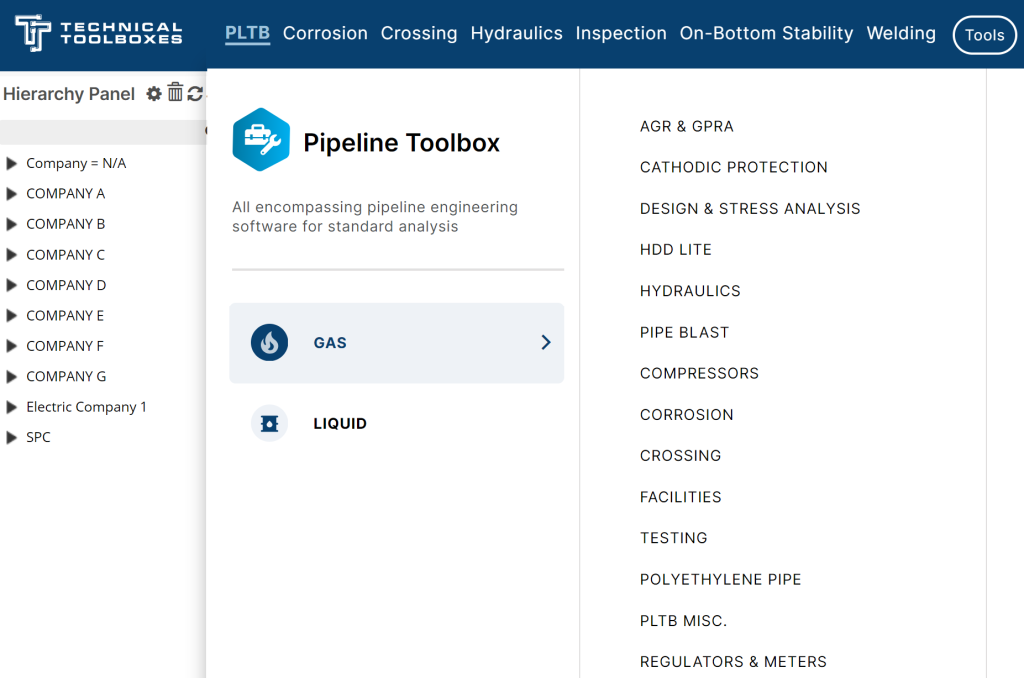
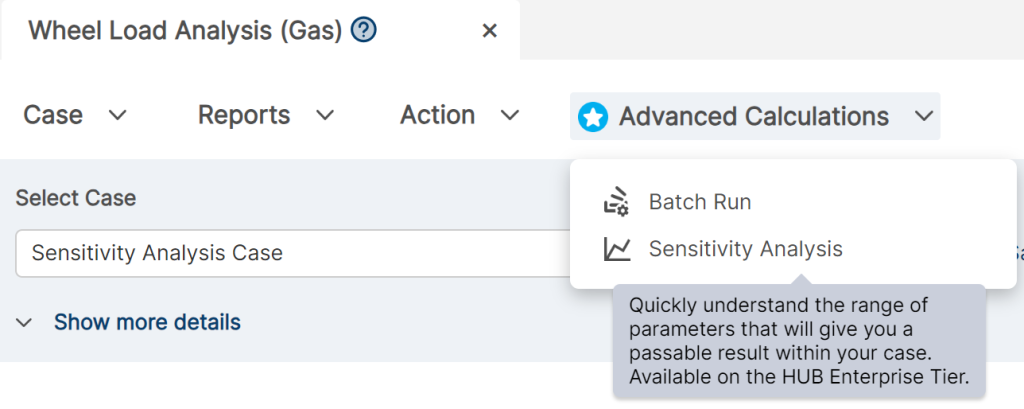
Accessing Sensitivity Analysis
For HUB Enterprise Tier clients, sensitivity analysis can be accessed in most of the calculators on Pipeline HUB. First select a calculator:
Sensitivity Analysis Types
Users are given two separate methods to quantify the inputs that will be analyzed in sensitivity analysis:
- Manual
- Automated
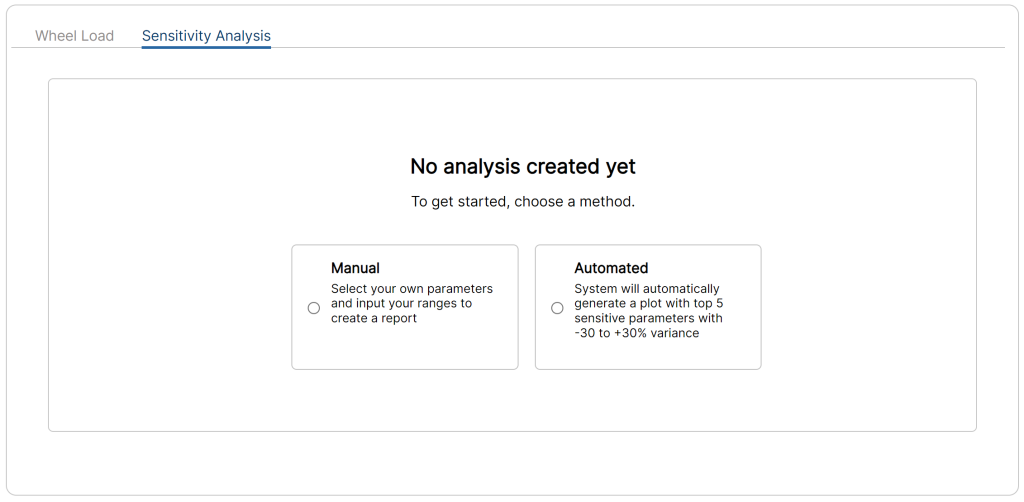
Manual
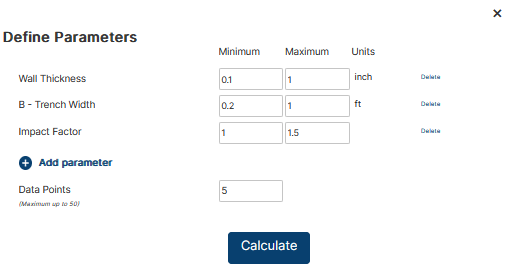
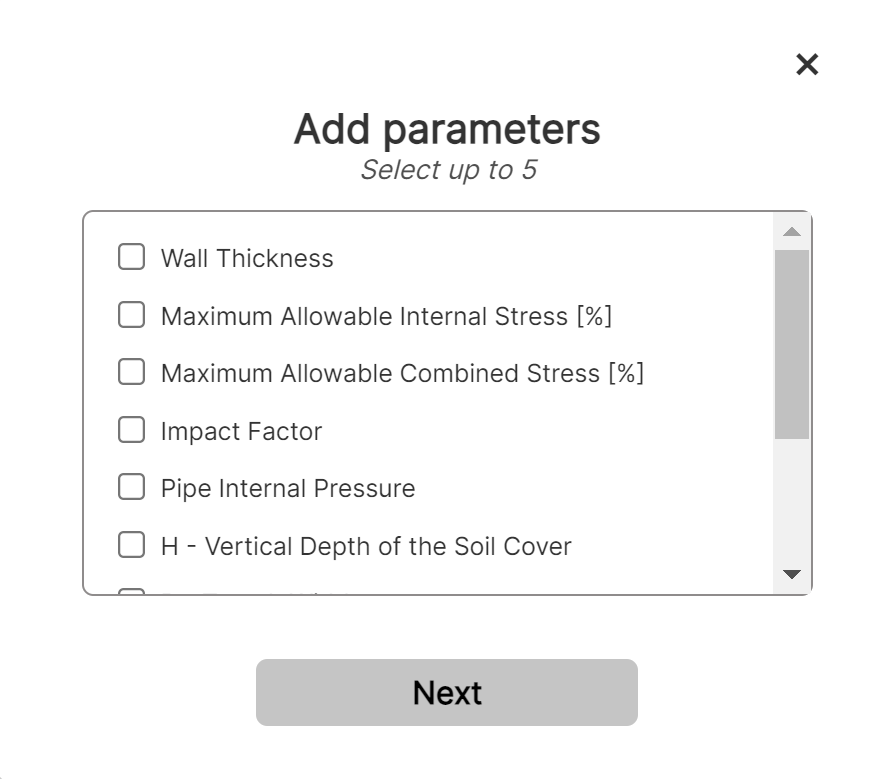
In Manual mode, the user is asked to select up to five parameters from a list. After selecting these parameters, the user is then directed to specify the minimum and maximum values they’d like to analyze, alongside the number of interpolated data points they’d like to see.
Manual Mode Results
After specifying your input parameter, Manual Sensitivity Analysis then gives a report on the results for each of these interpolated values, allowing an engineer to clearly see where and why his parameters might begin to cause safety concerns.
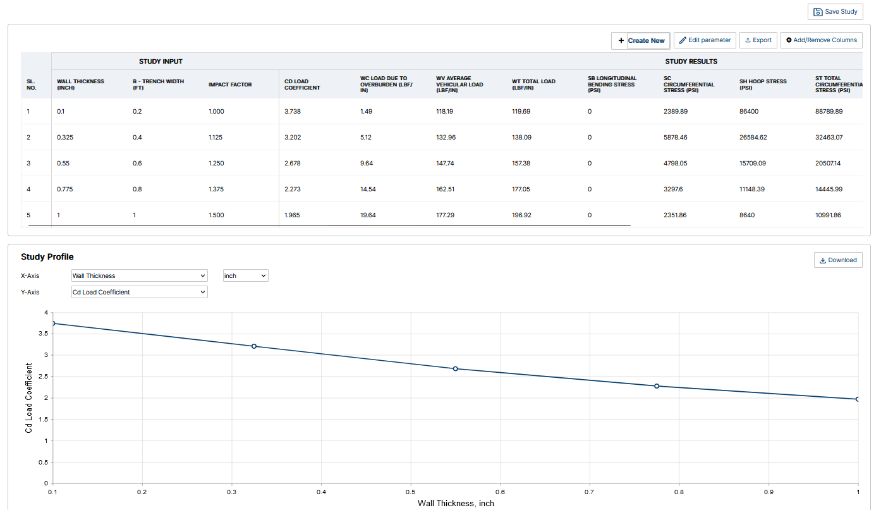
The top-most table includes the inputs and outputs for each of the inputs used in the Manual sensitivity analysis. Here, the user can analyze the effects of changing his parameters in exact detail and edit and save this manual analysis for future reference.
A plot on the bottom is included to show how certain results of the analysis changes with our different inputs. Please note that for this plot, the specified parameter (wall thickness, in this instance) may not necessarily be the only variable that changes; it simply represents the axis we normalize our results to.
Automatic
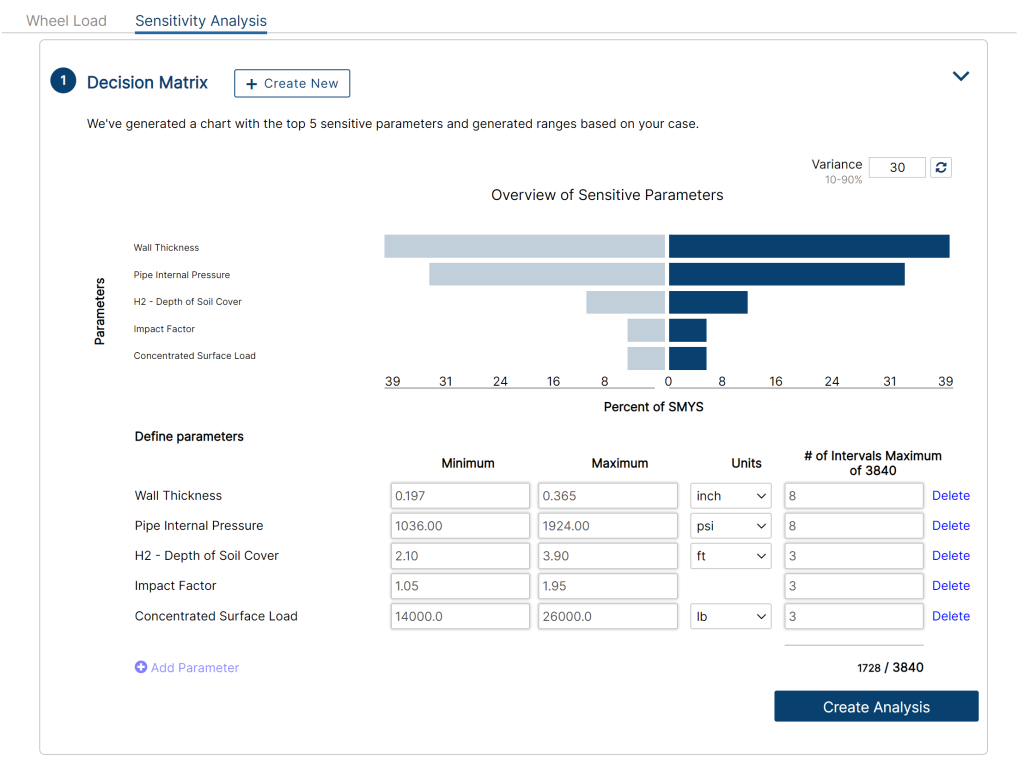
The generated decision matrix puts out the top 5 parameters affecting the calc from a variance perspective i.e. changes made to these 5 parameter’s affect the calc the most. These parameters’ can be deleted, added, and modified to generate a specific analysis.
Adding/Removing Parameters
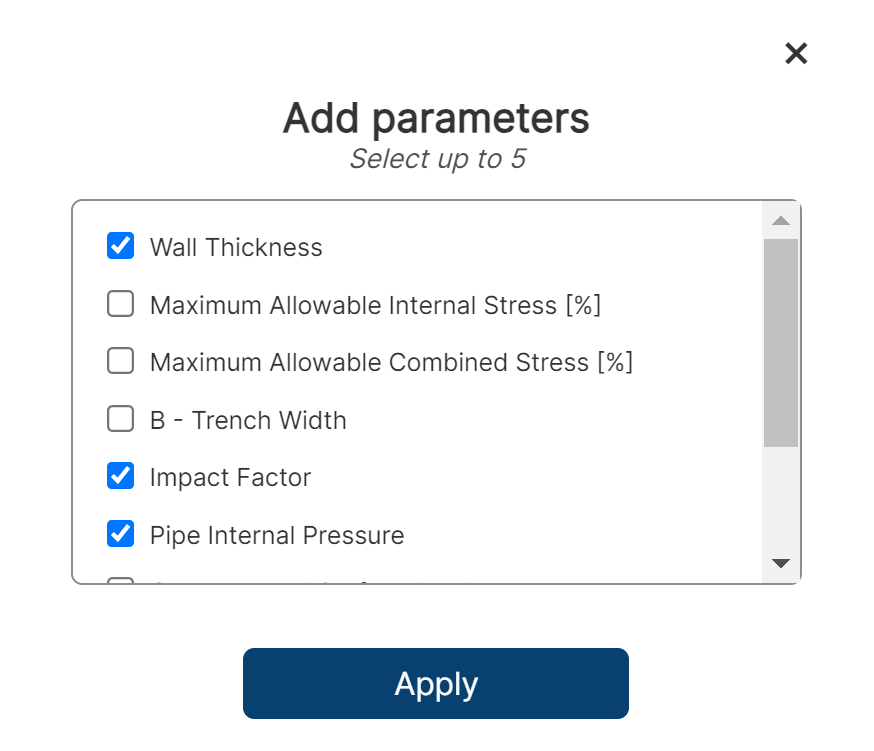
Clicking the highlighted Delete button on the right of the parameters will remove it from its analysis. The Add Parameter button in the lower left corner of the decision matrix will open up a window to further add/remove other parameters.
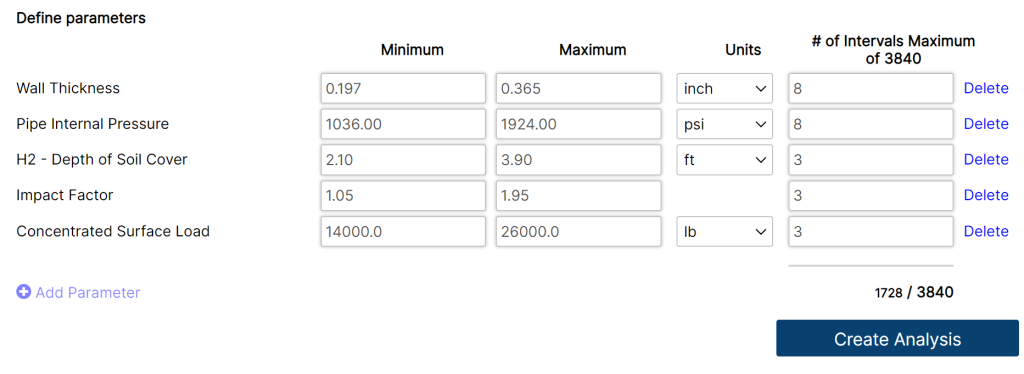
After having all required fields filled out, users can adjust the number of intervals per parameter. This leads to the total number of cases for the sensitivity analysis. Click on the Create Analysis button, and wait as the calculations are being generated from the backend.
Automatic Results
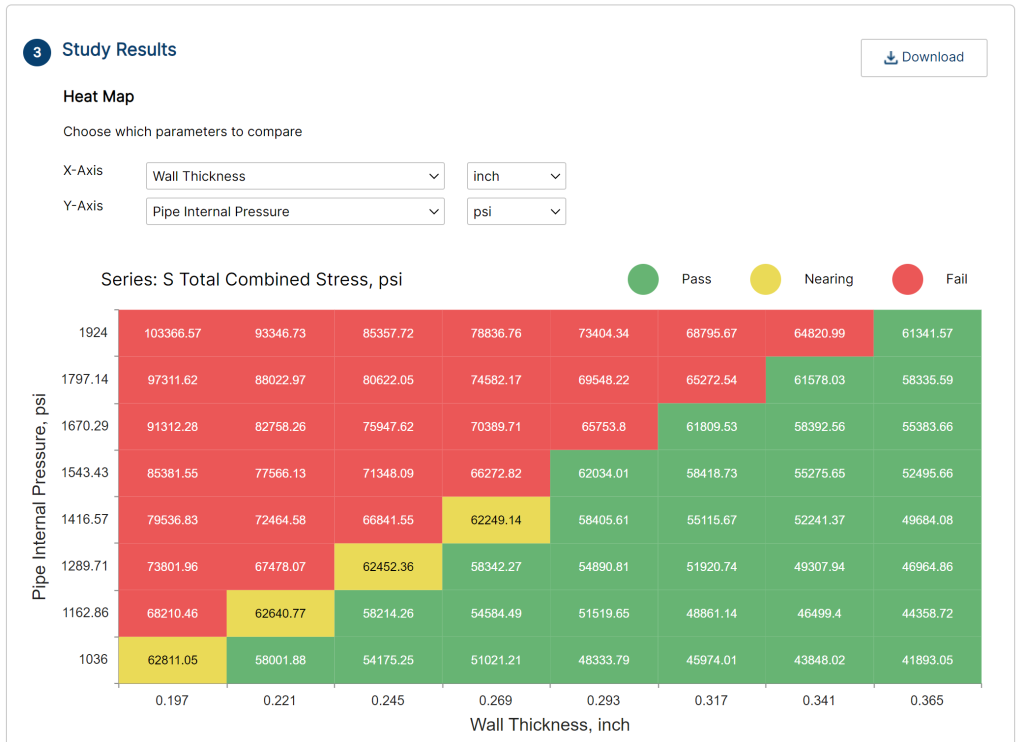
After the Automated Sensitivity Analysis completes, the application will show the results underneath the “Study Results” section.
A heat map will generate a visual aid to show a Pass/Nearing Fail/Fail status for the various parameters the user analyzed. Users can modify the heat map with the X-Axis and Y-Axis dropdown menu for different parameters. To study trends between parameters even further, users can explore the study plot, which is directly beneath the heat map. Users can select the parameters that they would like to study along the X and Y Axis. A graph will chart the parameters and demonstrate how they may or may not affect each other. Click the Download button to store the graph into your files.
Additionally, clicking the Export Data button toallows the user to download an excel sheet to see the results of every set in their calculation. The Study Results of automated sensitivity analysis allows an engineer to clearly determine how different results interplay with one another, and how they ultimately affect the stability and safety of his pipeline.
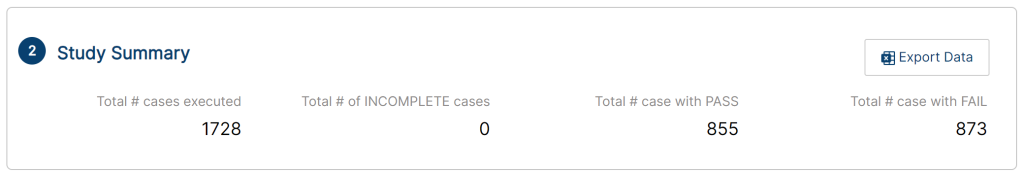
Study Summary
After the backend has calculated all cases, the study summary will showcase how many out of those cases were labeled as Incomplete/Pass/Fail. Click the Export Data button to download an excel sheet to see every calculation. Users can go further into detail in the heat map inside of study results.
Study Results
A heat map will generate a visual aid to show a Pass/Nearing/Fail status. Users can modify the heat map with the X-Axis and Y-Axis dropdown menu with various parameters. To study trends between parameters even further, users can explore the study plot, which is directly beneath the heat map.
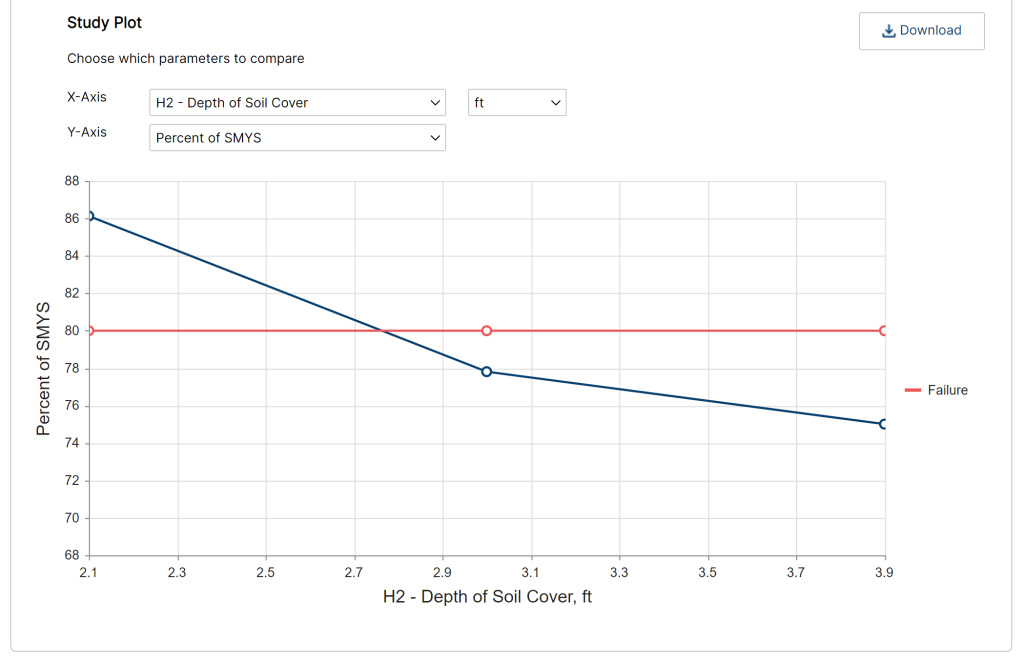
Study Plot
Users can select the parameters that they would like to study along the X and Y Axis. A graph will chart the parameters and demonstrate how they may or may not affect each other. Click the Download button to store the graph into your files.